


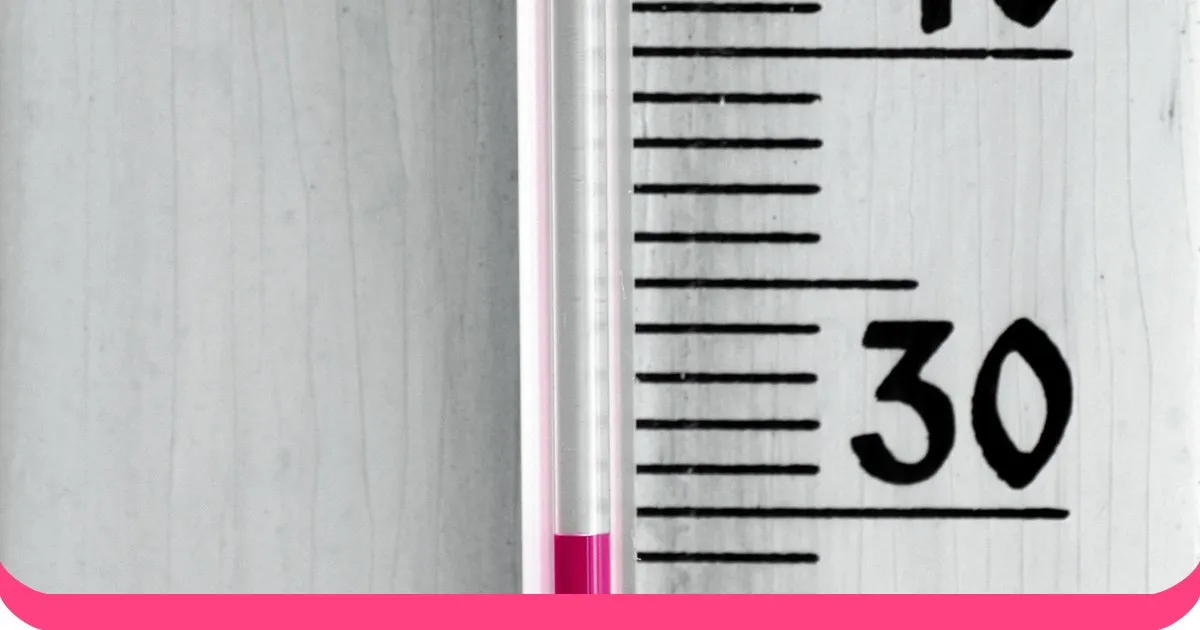
Measure something as 20°C one day and 30°C the next and you know the second day was 10 degrees warmer. But was it 'one and a half times as hot'? No, and the reason is the heart of interval scale measurement. This guide explains what an interval scale is, its key features, everyday examples, how it compares with nominal, ordinal and ratio scales, and how to collect interval-style ratings in a survey.
What is interval scale measurement?
An interval scale is a level of measurement where values are ordered and the gaps between them are equal, but there is no true zero. It is one of four levels of measurement, alongside nominal, ordinal and ratio. The four levels were set out by psychologist S. S. Stevens in his 1946 paper On the Theory of Scales of Measurement in विज्ञान.
Because the steps are equal, you can say how far apart two values are. Because zero is arbitrary, you cannot say one value is a multiple of another.
Key characteristics of interval scales
समान अंतराल
The gap between adjacent values is the same everywhere on the scale. The jump from 10°C to 11°C is the same size as the jump from 20°C to 21°C.
Arbitrary zero point
Zero is a convention, not 'nothing'. 0°C is where water freezes, not the absence of temperature. The Fahrenheit scale puts zero somewhere else entirely, and both are valid.
Addition and subtraction make sense
You can calculate differences, means and standard deviations. That is why interval data supports most common statistical tests.
Ratios do not make sense
With no true zero, 40°C is not 'twice as hot' as 20°C. Convert both to Fahrenheit (104°F and 68°F) and the ratio changes, which shows it was never meaningful. A ratio scale such as केल्विन, which starts at absolute zero, does support ratio statements.
Ordered values
Every value sits in a clear rank order, so you can say which is higher and by exactly how much.
5 examples of interval scale measurement
1. Temperature in Celsius or Fahrenheit
The textbook case. The difference between 20°C and 30°C equals the difference between 30°C and 40°C, but 0°C is not 'no heat'.
2. IQ scores
IQ tests are standardised so that equal score differences are treated as equal differences in performance, and a score of zero does not mean zero intelligence. Many researchers treat IQ as interval, though some argue it is closer to ordinal.
3. Calendar years
The gap from 1990 to 2000 equals the gap from 2000 to 2010. There is no 'zero' year that means an absence of time.
4. दिन का समय
On a 12-hour or 24-hour clock, the gap from 1:00 to 2:00 equals the gap from 3:00 to 4:00. Midnight is a convention, not the absence of time.
5. Standardised test scores
Scores on tests such as the SAT or GRE are scaled so that point differences are comparable. A score of zero does not mean 'no knowledge'. Like IQ, they are generally treated as interval.
Interval scales compared with other scales
| स्केल | यह आपको क्या बताता है? | उदाहरण | True zero? |
|---|---|---|---|
| नाममात्र | Categories only, no order | Fruit type: apple, banana, cherry | नहीं |
| क्रमवाचक | Order, but not the gaps | Race positions: 1st, 2nd, 3rd | नहीं |
| अंतराल | Order and equal gaps | Temperature in Celsius | नहीं |
| अनुपात | Order, equal gaps and a true zero | किलोग्राम में वजन | हाँ |
Each level contains the information of the one before it. Ratio scales allow every calculation, interval scales allow differences and averages, ordinal scales allow ranking and medians, and nominal scales allow counting.
Are survey rating scales interval?
This is where interval scales matter most for researchers. A five-point satisfaction rating looks like an interval scale, but the gap between 'satisfied' and 'very satisfied' may not feel equal to the gap between 'neutral' and 'satisfied'. That would make the data ordinal.
In practice, many researchers treat well-designed rating scales with five or more evenly labelled points as approximately interval. नॉर्मन (2010) found parametric tests hold up well on this data, while Jamieson (2004) argued that single Likert items should be analysed as ordinal. A sensible approach: label every point clearly, use evenly spaced numeric steps, and report medians and distributions alongside means.
Collect interval-style ratings with AhaSlides
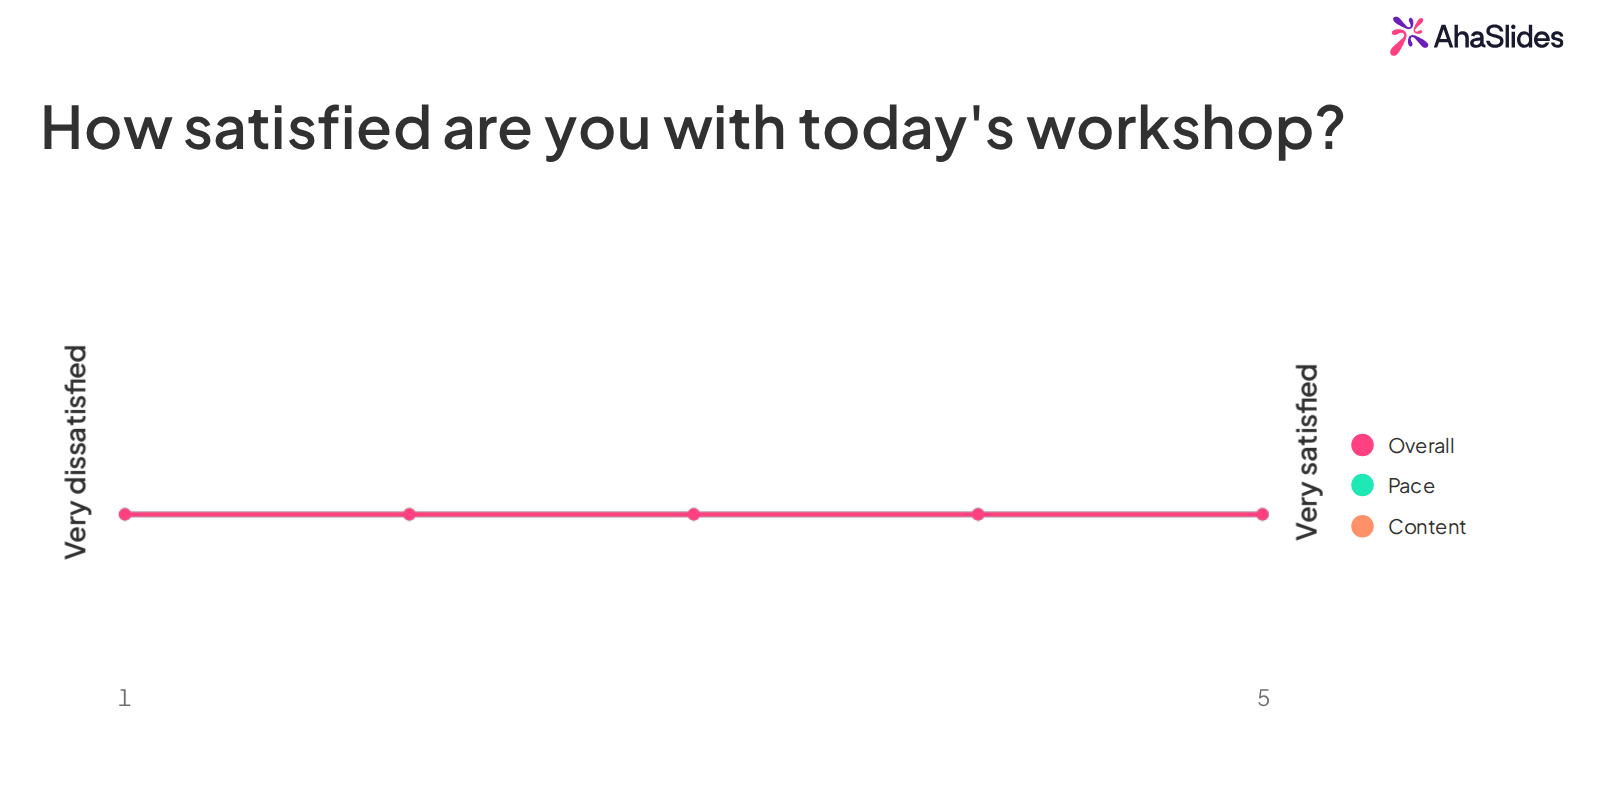
RSI AhaSlides रेटिंग स्केल lets you set a numeric range with labelled ends, for example 1 to 5 from very dissatisfied to very satisfied. Participants answer on their phones, and the average for each statement appears live. It suits customer satisfaction, employee engagement and audience feedback.
For more rating question formats, see our लिकर्ट स्केल उदाहरण और 5-point Likert scale guideया फिर से शुरू करें टेम्पलेट पुस्तकालय.
निष्कर्ष
Interval scales give you equal steps and meaningful differences, but no true zero and no ratios. Knowing which level you are working with decides which statistics are valid, so check it before you average, compare or report. When you collect ratings, label every point and keep the steps evenly spaced.
सूत्रों का कहना है
- Stevens, S. S. (1946). On the theory of scales of measurement. विज्ञान, 103 (2684), 677-680
- नॉर्मन, जी. (2010). लिकर्ट स्केल, माप के स्तर और सांख्यिकी के नियम। स्वास्थ्य विज्ञान शिक्षा में प्रगति, 15, 625-632
- Jamieson, S. (2004). Likert scales: how to (ab)use them. मैडिकल शिक्षा, 38 (12), 1217-1218
- NIST: Kelvin introduction
- forms.app: Interval scale
- QuestionPro: Interval scale