אין דעם געשעפט-סענטערד וועלט, עס ס קיין יבערראַשן אַז קאָמפּאַניעס זענען קעסיידער זוכן וועגן צו באַקומען אַ קאַמפּעטיטיוו מייַלע. פון ינאַווייטיוו פֿאַרקויף סטראַטעגיעס צו קאַטינג-ברעג טעכנאָלאָגיע, געשעפטן זענען שטענדיק אויף די לוקאַוט פֿאַר די ווייַטער גרויס זאַך וואָס וועט שטעלן זיי באַזונדער פון זייער קאָמפּעטיטאָרס. מיט דעם, זיי האָבן צו באַפרידיקן די טאָמיד-טשאַנגינג פאדערונגען און עקספּעקטיישאַנז פון קאַסטאַמערז.
איין וועג צו לייכט ידענטיפיצירן וואָס דאַרף צו זיין ימפּרוווד און אַדרעסד איז דורך די באַמערקונגען פון קאַסטאַמערז. אַ אָרדאַנאַל וואָג איז איין אופֿן וואָס קענען זיין גענוצט צו מעסטן קונה צופֿרידנקייט.
אויב דאָס איז דיין ערשטער מאָל איר הערן וועגן אַ אָרדאַנאַל וואָג, מיר האָבן איר באדעקט!
ונטער זענען 10 אַטראַקטיוו און ענגיידזשינג ביישפילן פון אָרדאַנאַל וואָג, אַלע געמאכט אויף AhaSlides פריי שטים ווייכווארג!
איבערבליק
| ווען איז די אָרדאַנאַל וואָג געפונען? | 1946 |
| ווער האט ינווענטיד די אָרדאַנאַל וואָג? | סס סטעווענס |
| ציל פון אָרדאַנאַל וואָג? | אָפּשאַצן פּאַרטיסאַפּאַנץ דורך ניצן אָרדערד רעספּאָנסעס |
| וואָס איז אן אנדער נאָמען פֿאַר ביישפילן פון אָרדאַנאַל וואָג? | קוואַליטאַטיווע דאַטן אָדער קאַטאַגאָריקאַל דאַטן |
| איז דער פּראָצענט נאָמינאַל אָדער אָרדאַנאַל? | נאָמינאַל |
טיש פון קאָנטענץ
- איבערבליק
- וואָס איז אַן אָרדינאַל וואָג?
- 10 אָרדינאַל וואָג ביישפילן
- אָרדינאַל וואָג קעגן אנדערע טייפּס פון וואָג
- אנדערע וועגן צו באַקומען
- שליימעסדיק אָנליין פּאָללינג געצייַג
- אָפֿט געשטעלטע פֿראגן
וואָס איז אַן אָרדינאַל וואָג?
An אָרדענונג וואָג, אויך גערופן צו אָרדאַנאַל דאַטן, איז אַ טיפּ פון מעזשערמאַנט וואָג וואָס אַלאַוז מענטשן צו ריי אָדער אָפּשאַצן זאכן באזירט אויף זייער קאָרעוו שטעלע אָדער ייבערהאַנט. עס גיט אַ סטראַקטשערד וועג צו זאַמלען באַמערקונגען און פֿאַרשטיין די צופֿרידנקייט פון קאַסטאַמערז מיט אַ פּראָדוקט אָדער דינסט
פשוט, עס איז אַ סטאַטיסטיש סקיילינג סיסטעם וואָס אַפּערייץ מיט טאָלק. וסואַללי, אָרדאַנאַל וואָג אַרבעט אויף אַ קסנומקס צו קסנומקס אָדער צו קסנומקס צו קסנומקס שאַץ סיסטעם, מיט 1 רעפּריזענטינג די לאָואַסט ווערט ענטפער און 10 רעפּריזענטינג דעם העכסטן ווערט ענטפער.
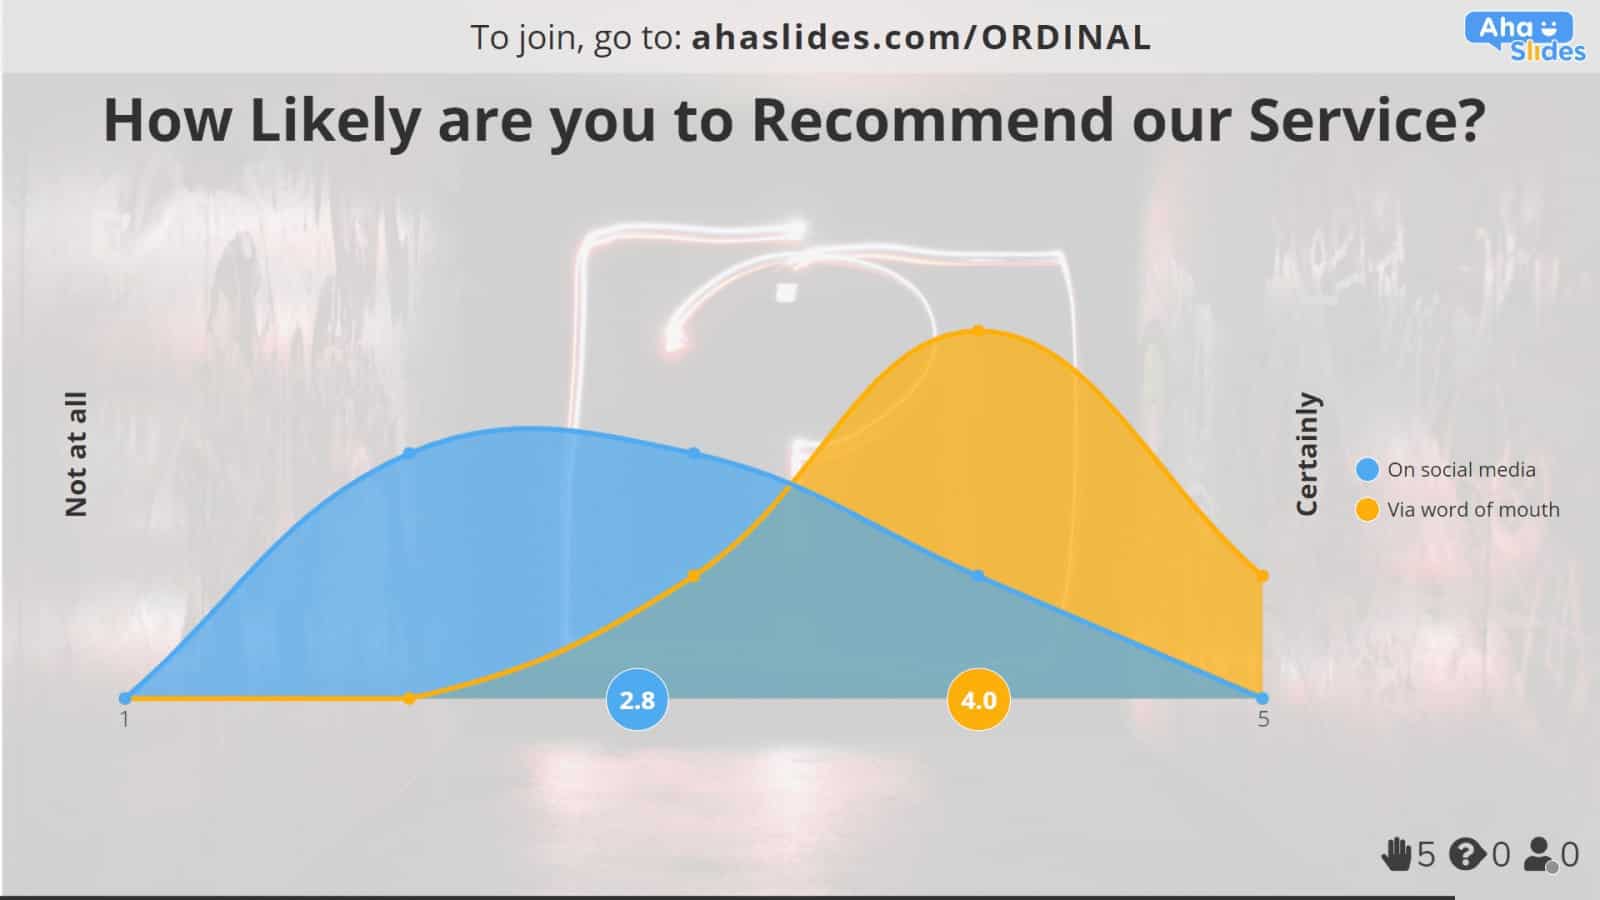
צו באַקומען אַ קלירער בילד, לאָזן אונדז קוק אויף אַ יבער גלייך און פּראָסט ביישפּיל: ווי צופֿרידן זענען איר מיט אונדזער באַדינונגס?
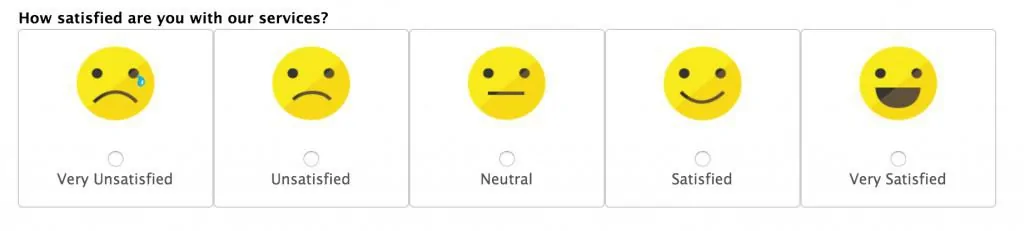
גיכער זענען אַז איר האָט געזען דעם טיפּ פון אָרדאַנאַל וואָג ביישפּיל פריער. עס איז געניצט צו מעסטן קונה צופֿרידנקייט אויף אַ 5-פונט וואָג:
- זייער ונסאַטיספייד
- ונסאַטיספייד
- נייטראַל
- זאַט
- זייער צופֿרידן
געוויינטלעך, קאָמפּאַניעס קענען נוצן אַן אָרדענונג פון אַ צופֿרידנקייט צו באַשליסן אויב זיי דאַרפֿן צו פֿאַרבעסערן זייער דינסט. אויב זיי קעסיידער סקאָרד נידעריק נומערן (1 ס און 2 ס), עס מיטל אַז די קאַמף איז פיל מער דרינגלעך ווי אויב זיי האָבן סקאָרד הויך נומערן (4 ס און 5 ס).
דערין ליגט די שיינקייט פון אָרדאַנאַל וואָג: זיי זענען זייער פּשוט און קלאָר. מיט דעם, עס איז גרינג צו קלייַבן און פונאַנדערקלייַבן דאַטן אין לעגאַמרע קיין פעלד. זיי נוצן ביידע קוואַליטאַטיווע און קוואַליטאַטיווע דאַטן צו טאָן דאָס:
- קוואַליטאַטיווע - אָרדינאַל וואָג זענען קוואַליטאַטיווע ווייַל זיי פאָקוס אויף ווערטער וואָס דעפינירן אַ ספּעציפיש ווערט. צום ביישפּיל, מענטשן וויסן וואָס אַ באַפרידיקנדיק דערפאַרונג איז ווי עס איז שווער פֿאַר זיי צו דעפינירן אַ '7 פון 10' דערפאַרונג.
- קוואַנטיטאַטיווע - זיי זענען קוואַנטיטאַטיווע ווייַל יעדער וואָרט קאָראַספּאַנדז צו אַ נומער ווערט. אויב אַ אָרדאַנאַל אין פאָרשונג דיפיינז אַ באַפרידיקנדיק דערפאַרונג ווי אַ דערפאַרונג פון 7 אָדער 8 פון 10, זיי קענען לייכט פאַרגלייַכן און טשאַרט אַלע די געזאמלט דאַטן דורך נומערן.
פון קורס, עס זענען פילע ביישפילן פון אָרדאַנאַל וואָג אַרויס די צופֿרידן / ניט צופֿרידן ענטפער שטעלן (אַרייַנגערעכנט ווי אַ טיפּ פון ויספרעג). לאָמיר נעמען אַ קוק בייַ עטלעכע פון זיי ....
10 אָרדינאַל וואָג ביישפילן
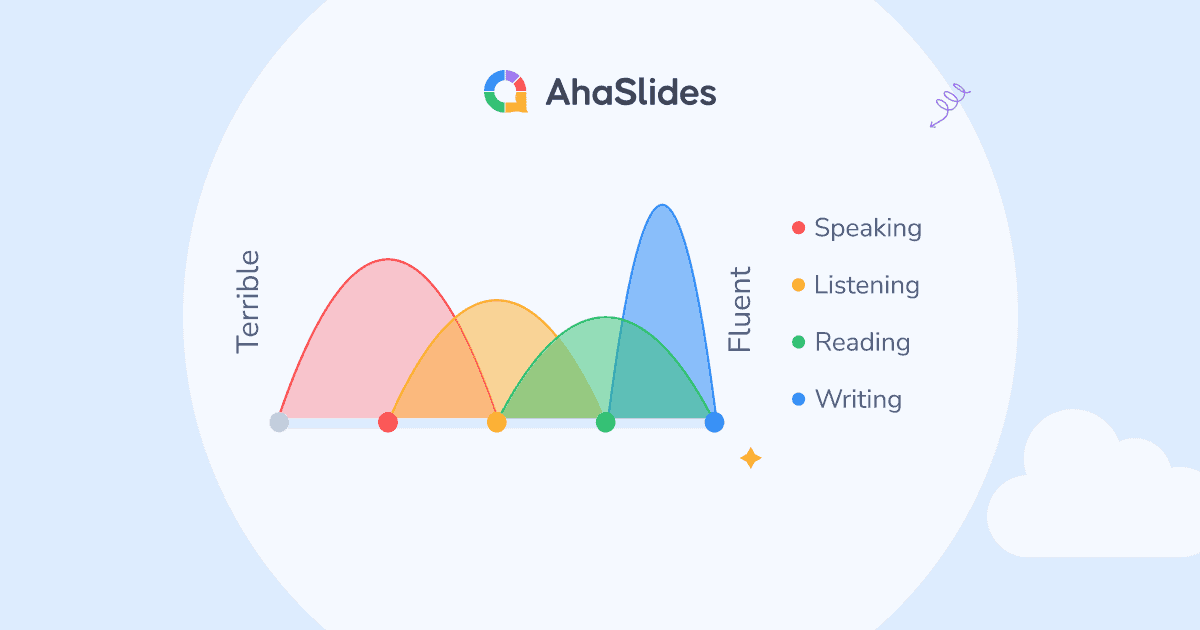
שאַפֿן קיין פון די אָרדאַנאַל וואָג אונטן פֿאַר פריי מיט AhaSlides. AhaSlides אַלאַוז איר צו שאַפֿן אַ אָרדאַנאַל וואָג מיט פֿראגן, סטייטמאַנץ און וואַלועס, און לאָזן דיין וילעם אַרייַנשרייַבן זייער מיינונג לעבן מיט זייער רירעוודיק פאָנעס.
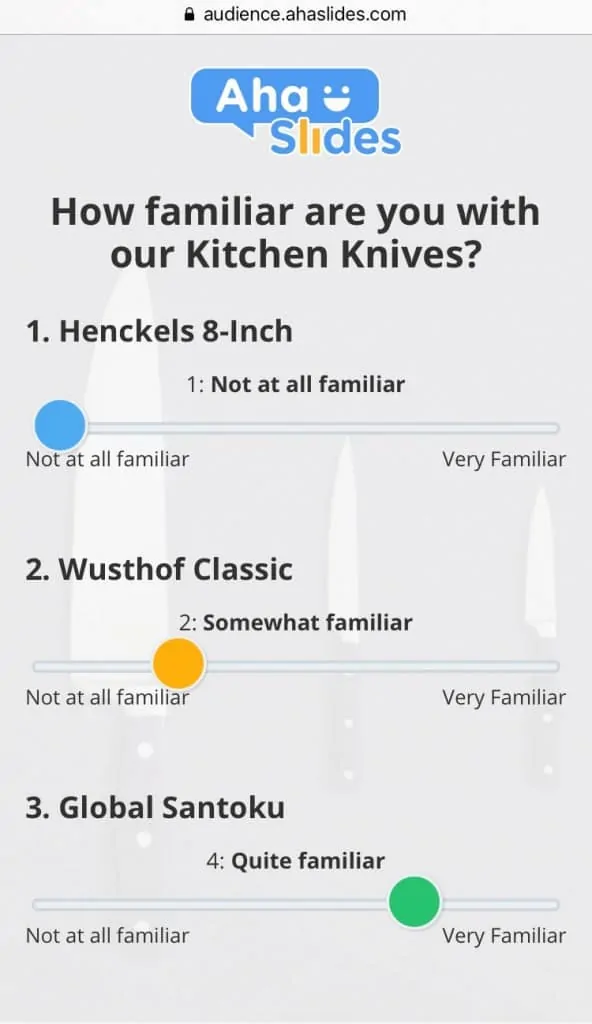
טיפּ # 1 - פאַמיליעראַטי
[בכלל ניט באַקאַנט - אַ ביסל באַקאַנט - מעסיק באַקאַנט - גאַנץ באַקאַנט - זייער באַקאַנט]
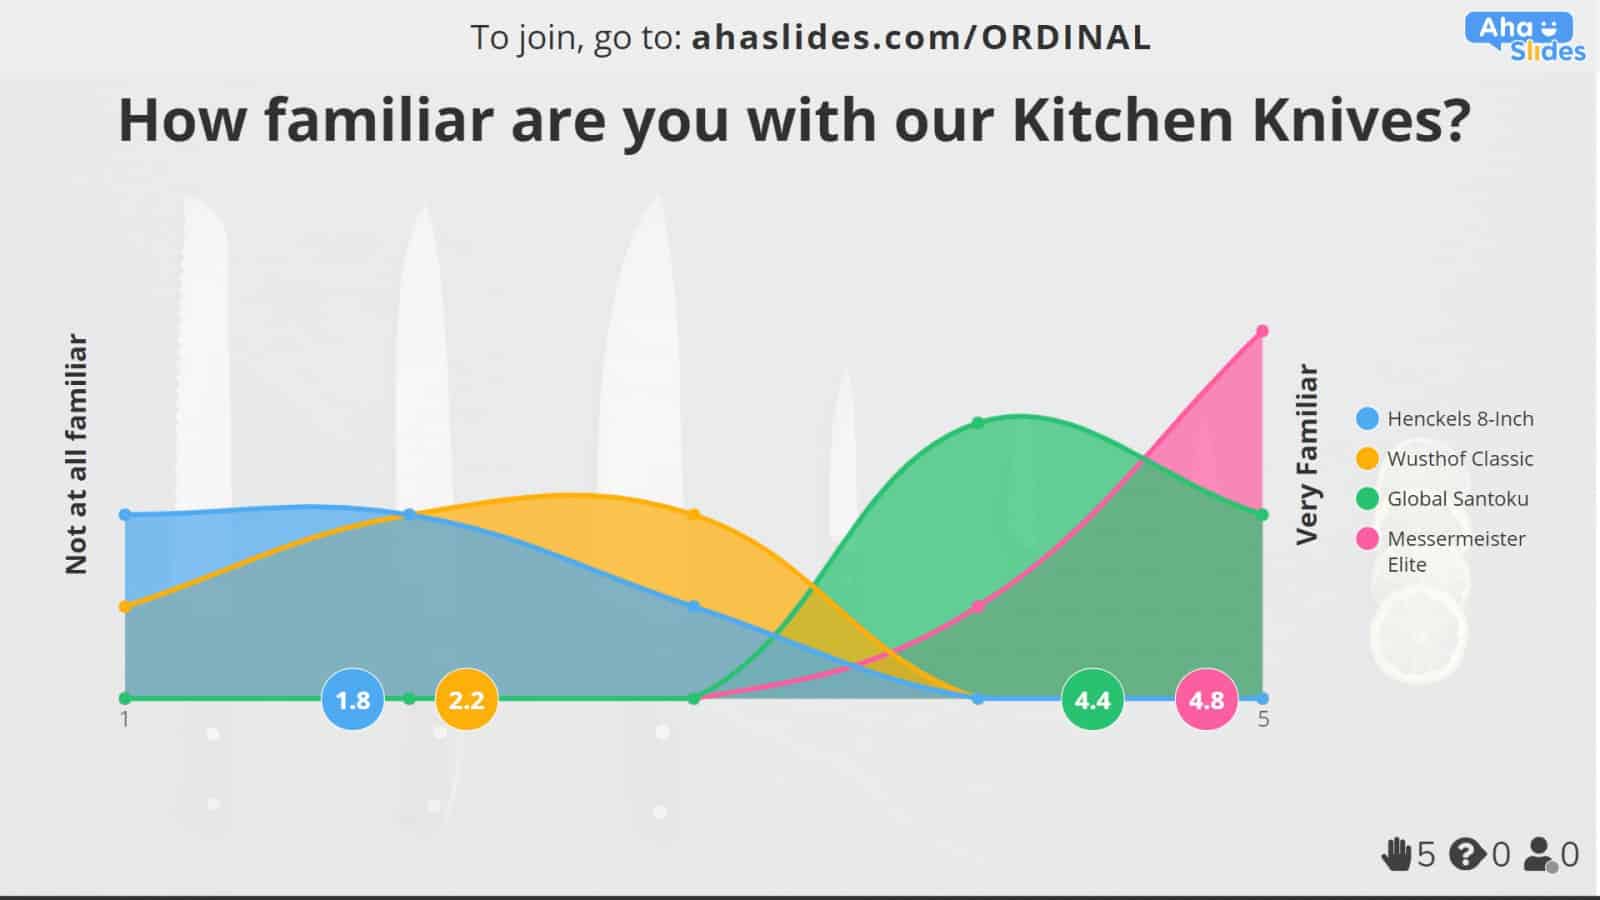
פאַמיליאַריטי אָרדינאַל סקאַלעס זענען געניצט צו קאָנטראָלירן דער מדרגה פון וויסן אַז עמעצער האט וועגן אַ זיכער טעמע. דעריבער, זיי זענען סופּער נוציק פֿאַר ינפאָרמינג צוקונפֿט גאַנצע השתדלות, וויסיקייַט קאַמפּיינז און בילדונגקרייז פּלאַנז.
עטלעכע ביישפילן פון פאַמיליאַריטי אָרדאַנאַל סקאַלע:
- א פירמע טעסטינג די וילעם צו זען ווי באַקאַנט מיט עטלעכע פּראָדוקטן. די דאַטן וואָס רעזולטאַט פון דעם קענען פירן צו גאַנצע השתדלות צו פּראָדוקטן וואָס סקאָרד נידעריקער פאַמיליעראַטי.
- א לערער טעסטינג זייער סטודענטן אויף פאַמיליעראַטי פון אַ זיכער טעמע. דאָס גיט דעם לערער אַ געדאַנק פון וואָס מדרגה פון פריערדיקן וויסן וועגן דעם טעמע קענען זיין אנגענומען איידער ער באַשלאָסן ווו צו אָנהייבן לערנען עס.
דאַרפֿן מער לעבן פּאָללס פֿאַר די קלאַסצימער? טשעק אויס די 7 דאָ!
טיפּ # 2 - אָפטקייַט
[קיינמאָל - ראַרעלי - מאל - אָפט - שטענדיק]
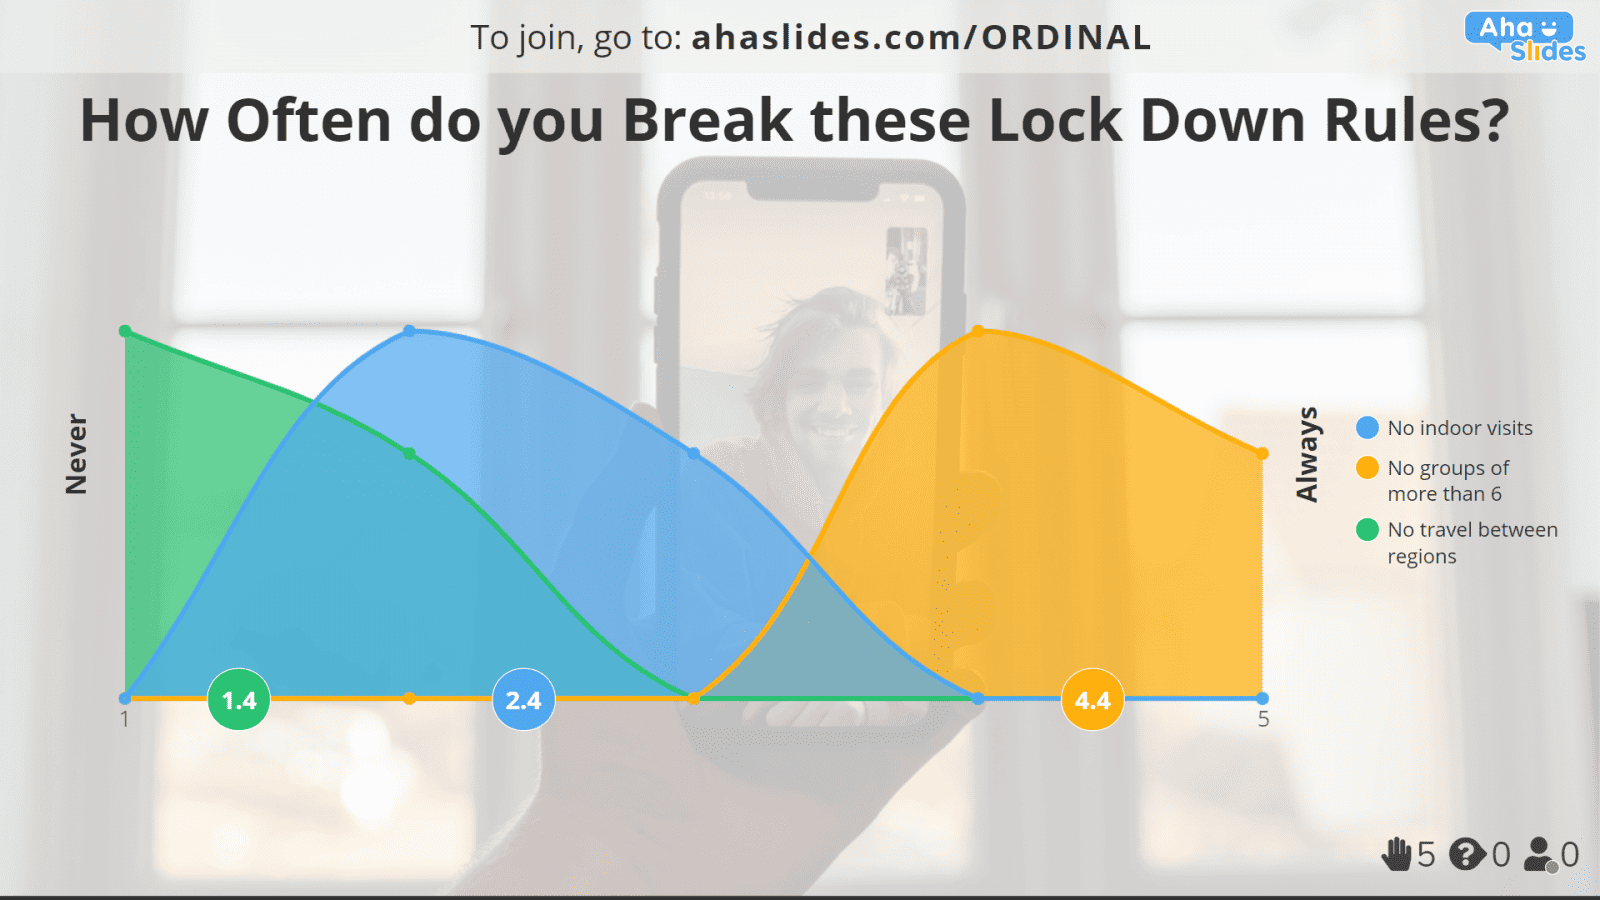
אָפטקייַט אָרדאַנאַל סקאַלעס זענען געניצט צו מעסטן ווי אָפט אַ טעטיקייט איז פּערפאָרמד. זיי זענען נוציק פֿאַר דזשאַדזשינג אַקטיוו ביכייוויערז און וווּ איר קענען טוישן זיי.
עטלעכע ביישפילן פון אָפטקייַט אָרדאַנאַל סקאַלע:
- אַ אָרדאַנאַל יבערבליק קאַלעקטינג אינפֿאָרמאַציע וועגן די גראַד צו וואָס דער ציבור נאָכפאָלגן כּללים. די דאַטן קענען ווערן גענוצט צו באַשטימען ווי גוט אָדער ווי שוואַך אַ ציבור אינפֿאָרמאַציע קאמפאניע איז פּערפאָרמינג.
- א פירמע קאַלעקטינג אינפֿאָרמאַציע וועגן ווי אַ קוינע איז ינפלואַנסט אויף זייער וועבזייטל. די פירמע קענען נוצן די דאַטן צו פאָקוס אויף זיכער טייפּס פון מער פאָלקס מעדיע, ווי ווידעא אָדער באַנער אַדס, ווי קעגן צו אנדערע ווייניקער-וויוד מידיאַ.
טיפּ # 3 - ינטענסיטי
[קיין ינטענסיטי - מילד ינטענסיטי - מיטל ינטענסיטי - שטאַרק ינטענסיטי - עקסטרעם ינטענסיטי]
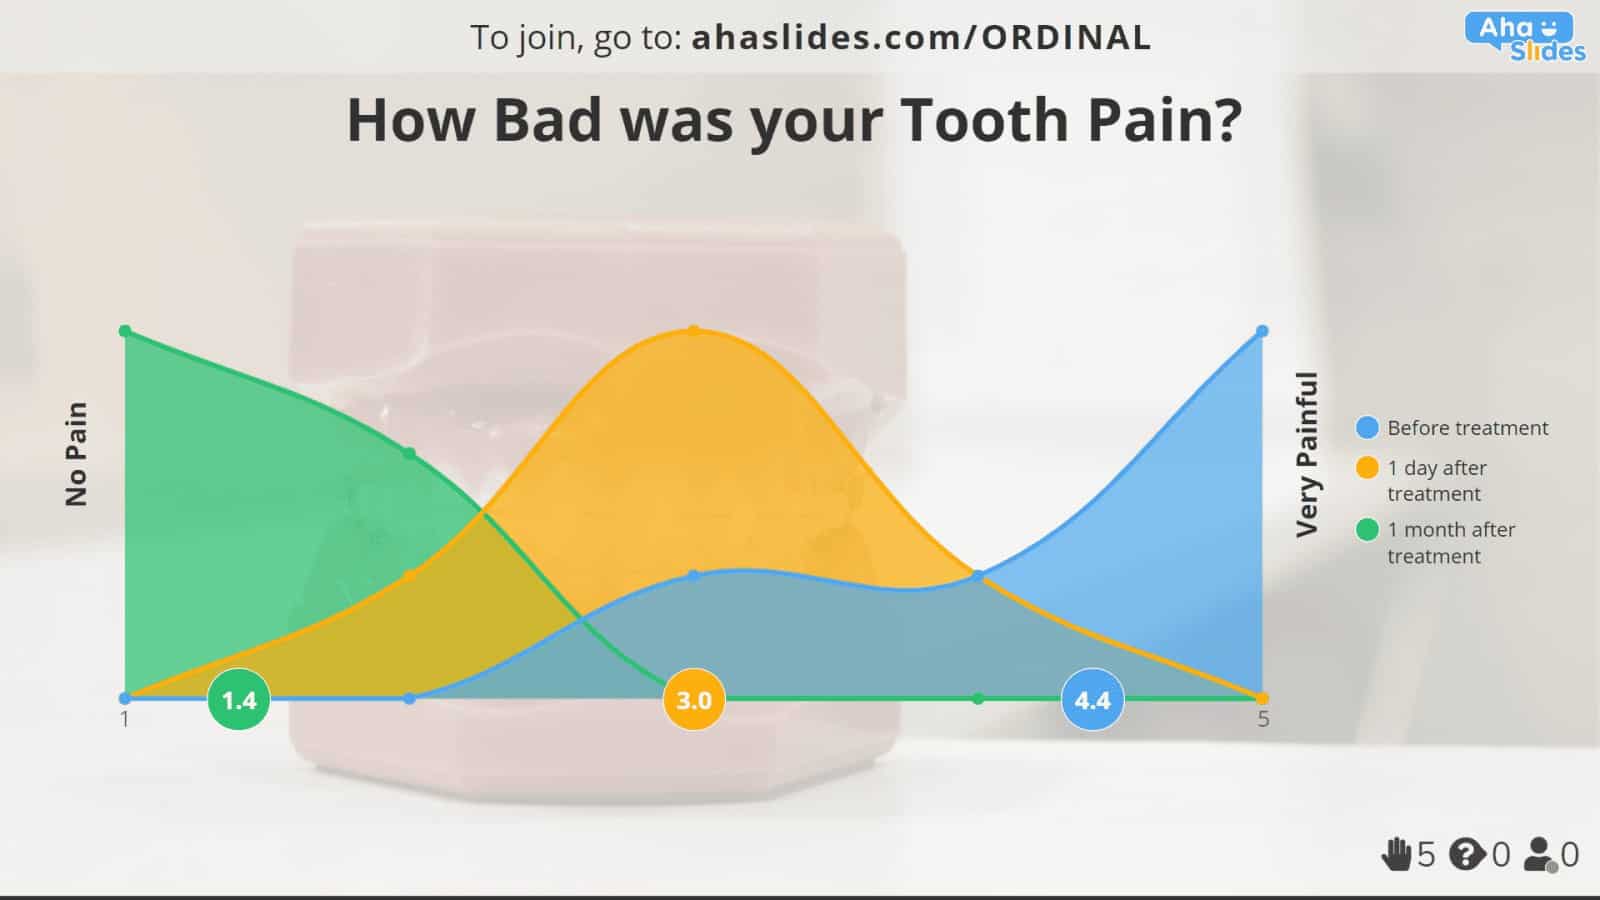
ינטענסיטי אָרדאַנאַל סקאַלעס יוזשאַוואַלי פּרובירן די שטאַרקייט פון אַ געפיל אָדער דערפאַרונג. דאָס איז אָפט אַ שווער מעטריק צו מעסטן ווייַל עס איז שייך צו עפּעס מער קאַנסעפּטשואַל און סאַבדזשעקטיוו ווי וואָס איז יוזשאַוואַלי געמאסטן אין אָרדאַנאַל וואָג.
עטלעכע ביישפילן פון ינטענסיטי אָרדאַנאַל סקאַלע:
- א מעדיציניש פאַרלייגן טעסטינג פּאַטיענץ אויף זייער באמערקט לעוועלס פון ווייטיק איידער און נאָך באַהאַנדלונג. די דאַטע קענען ווערן גענוצט צו באַשליסן די עפיקאַסי פון אַ דינסט אָדער פּראָצעדור.
- A קירך דינסט טעסטינג טשערטשאַדזשערז אויף די מאַכט פון אַ דראָשע. זיי קענען נוצן די דאַטן צו זען צי זייער פּאַסטער זאָל סאַק אָדער נישט.
טיפּ # 4 - וויכטיקייט
[גארנישט וויכטיג - קוים וויכטיג - אביסל וויכטיג - עטוואס וויכטיג - גאנץ וויכטיג - זייער וויכטיג - וויכטיג]

וויכטיקייט אָרדאַנאַל סקאַלעס קורס ווי ניט-יקערדיק אָדער יקערדיק מענטשן געפֿינען אַ פּראָדוקט, דינען, סעקטאָר, טעטיקייט אָדער שיין פיל עפּעס צו זיין. די רעזולטאַטן פון דעם טיפּ פון אָרדאַנאַל וואָג זענען אָפט חידוש, אַזוי געשעפטן זאָל באַטראַכטן דעם טיפּ פון וואָג צו באַקומען ווערטפול ינסייץ וועגן די באמערקט וויכטיקייט פון זייער אָפרינגז. די אינפֿאָרמאַציע קענען העלפֿן זיי פּרייאָראַטייז רעסורסן און פאָקוס אויף געביטן וואָס טאַקע ענין צו זייער קאַסטאַמערז.
עטלעכע ביישפילן פון וויכטיקייט אָרדאַנאַל סקאַלע:
- א רעסטאָראַן אַסקינג קאַסטאַמערז צו שטעלן די מערסט וויכטיק זאַך פֿאַר זיי. דאַטן פון דאָ קענען ווערן גענוצט צו רעכענען אויס וואָס טיילן פון דינסט דאַרפֿן די מערסט ופמערקזאַמקייט פון פאַרוואַלטונג.
- א יבערבליק זאַמלונג מיינונגען אויף אַטאַטודז צו דיעטע און געניטונג. דאַטן קענען ווערן גענוצט צו געפֿינען אויס ווי וויכטיק דער ציבור זעט זיכער אַספּעקץ פון בעכעסקעם פּאַסיק.
טיפּ # 5 - העסקעם
[שטארק נישט מסכים - נישט מסכים - נישט מסכים אדער נישט מסכים - שטימען - שטארק מסכים]
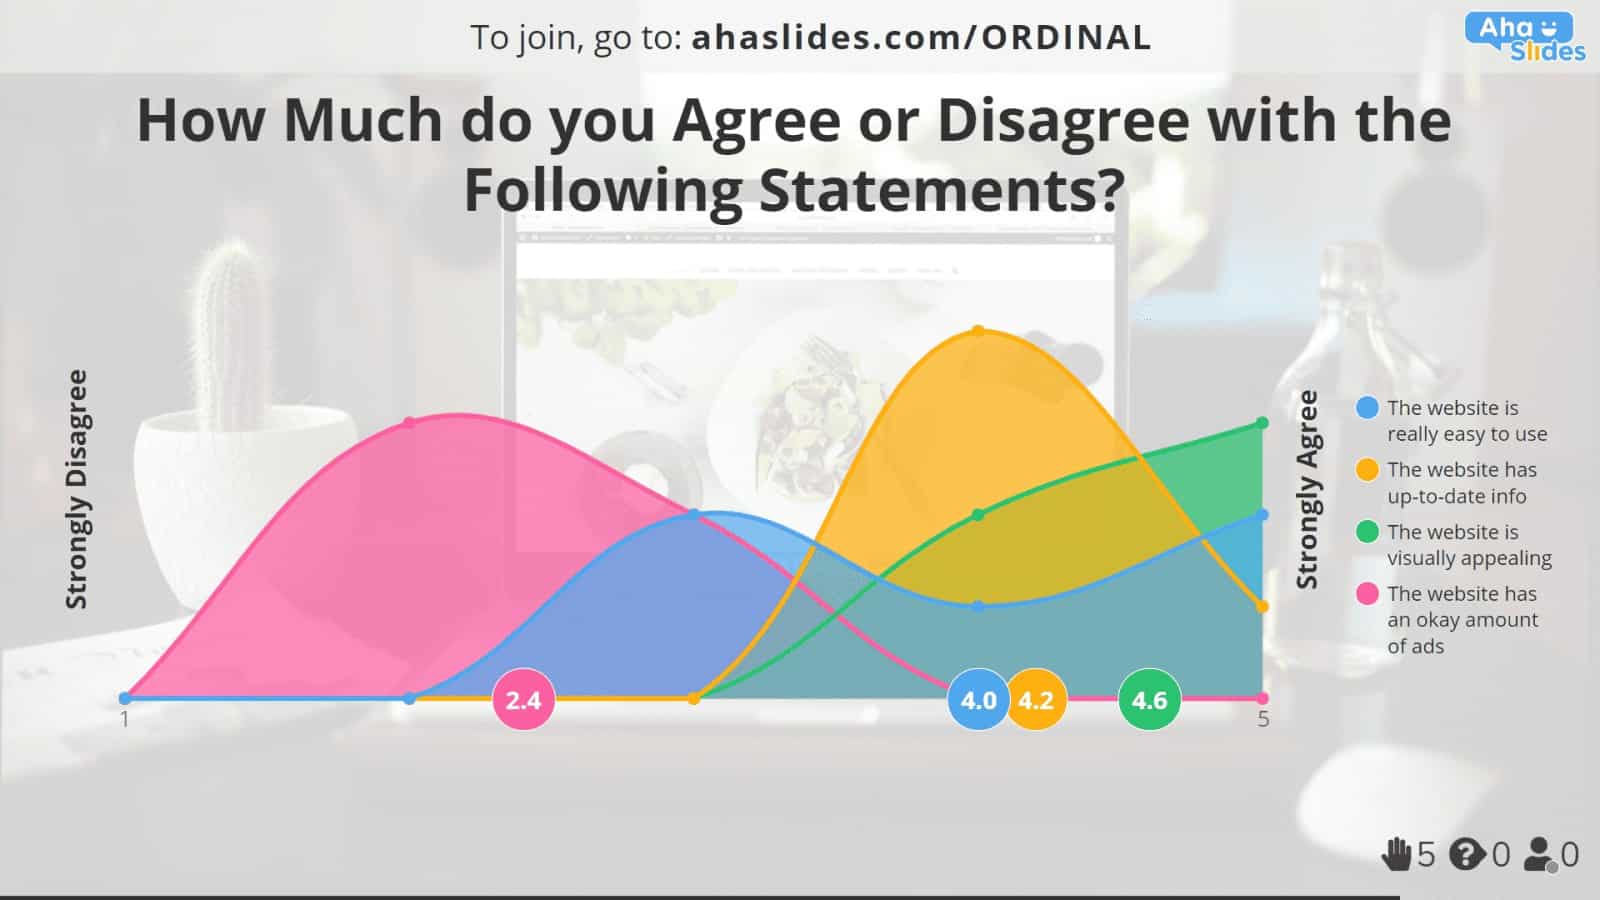
העסקעם אָרדאַנאַל סקאַלעס העלפֿן צו באַשליסן אין וואָס גראַד אַ מענטש דיסאַגריז אָדער אַגריז מיט אַ דערקלערונג. דאָס זענען עטלעכע פון די מערסט וויידלי געוויינט ביישפילן פֿאַר אָרדענונג וואָג, ווייַל זיי קענען זיין געוויינט מיט קיין ויסזאָגונג אַז איר ווילט אַ ספּעציפיש ענטפער צו.
עטלעכע ביישפילן פון העסקעם אָרדאַנאַל סקאַלע:
- א פירמע סערווייינג זייער קאַסטאַמערז וועגן די וסאַביליטי פון זייער וועבזייטל. זיי קענען מאַכן ספּעציפיש סטייטמאַנץ וועגן וואָס די פירמע זיך מיינט און זען אויב זייערע וסערס שטימען אָדער דיסאַגרי מיט די סטייטמאַנץ.
- א באַלעבאָס וואָס קאַלעקץ אָנגעשטעלטער מיינונגען וועגן די ווערקפּלייס סוויווע. דעפּענדינג אויף די לעוועלס פון ומהעסקעם און צושטימען צו זייער סטייטמאַנץ, זיי קענען געפֿינען זיך וואָס דאַרף פאַרריכטן פֿאַר די עמפּלוייז.
טיפּ # 6 - צופֿרידנקייט
[דיפּלי דיסאַטאַספייד - דיסאַטאַספייד - עפּעס דיסאַטאַספייד - נייטראַל - עפּעס צופֿרידן - צופֿרידן - זייער צופֿרידן]
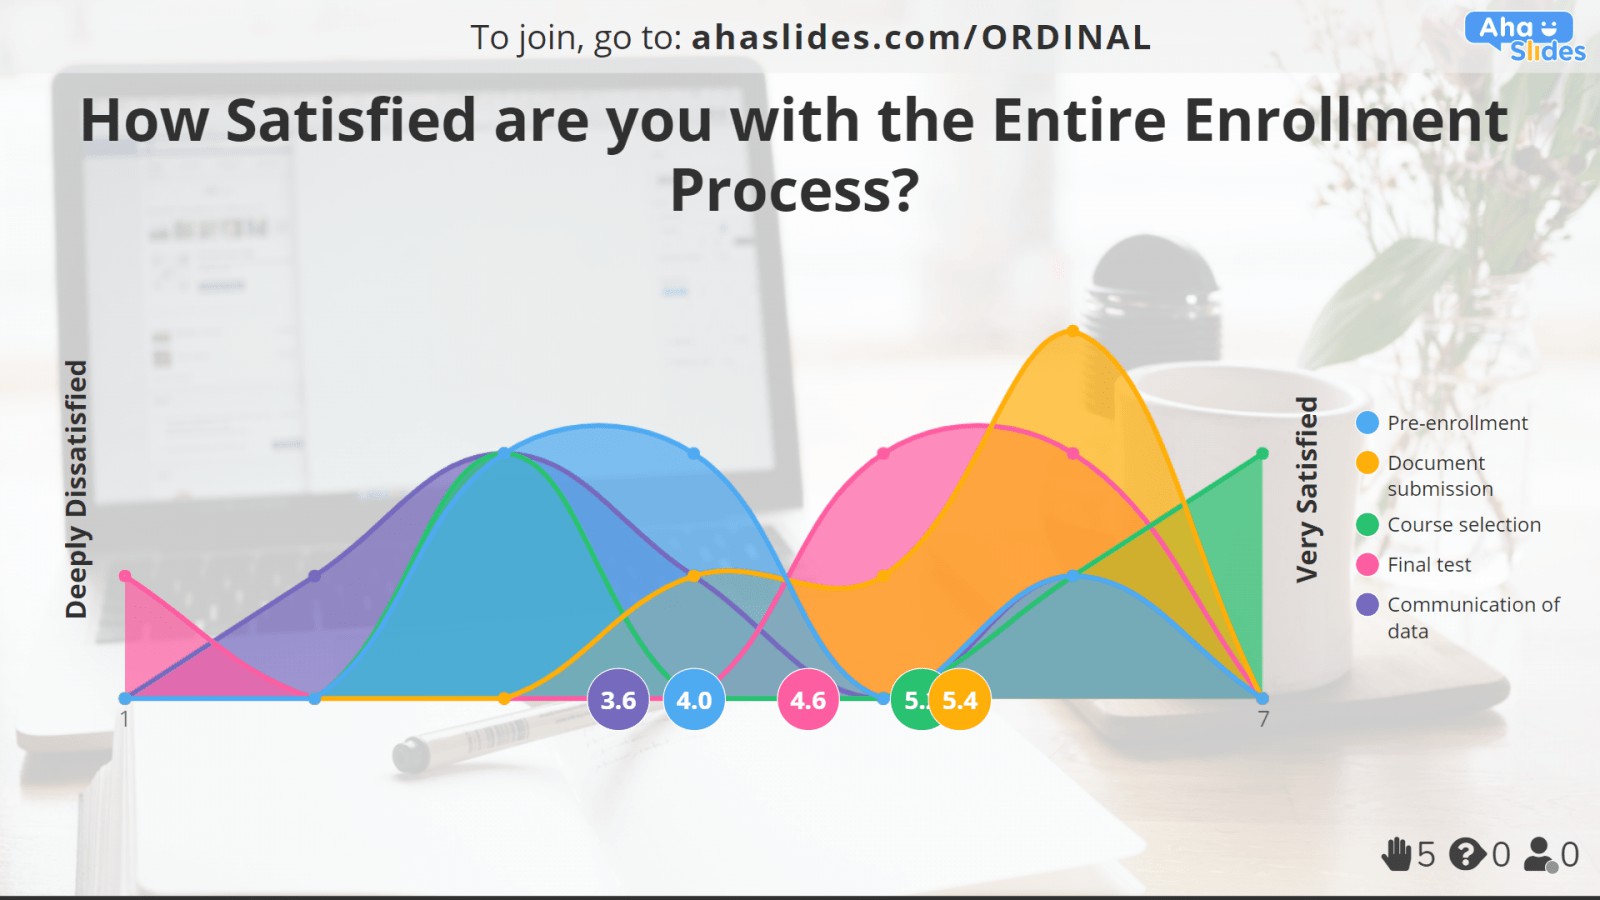
ווידער, דאָס איז אַ וויידלי געוויינט בייַשפּיל פון אַן אָרדינאַל וואָג, ווי 'צופֿרידנקייט' איז די לעצט ציל פון געשעפטן. אַלע פּאַרץ פון אַ יבערבליק, אין איין וועג אָדער אנדערן, פּרובירן צו זאַמלען אינפֿאָרמאַציע וועגן צופֿרידנקייט וועגן אַ דינסט, אָבער צופֿרידנקייט אָרדאַנאַל וואָג טאָן דאָס אָוווערטלי און דאָך.
עטלעכע ביישפילן פון צופֿרידנקייט אָרדאַנאַל סקאַלע:
- א אוניווערסיטעט צונויפקום לעוועלס פון צופֿרידנקייט וועגן זייער ענראָולמאַנט דינסט. די דאַטן קענען העלפֿן זיי באַשליסן וואָס אַספּעקט דאַרף ימפּרוווינג די מערסט פֿאַר פּאָטענציעל צוקונפֿט סטודענטן.
- א פּאָליטיש פּאַרטיי וואָס פּאָללס זייער סופּפּאָרטערס וועגן זייער השתדלות איבער די לעצטע יאָר. אויב זייערע סופּפּאָרטערס זענען אין קיין וועג דיסאַטאַספייד מיט די פּראַגרעשאַן פון דער פּאַרטיי, זיי קענען אָנהייבן פּאָללינג זיי וועגן וואָס זיי וואָלט ווי דיפערענטלי.
טיפּ # 7 - פאָרשטעלונג
[גוט אונטער סטאַנדאַרדס - ונטער עקספּעקטיישאַנז - וועגן ווי דערוואַרט - העכער עקספּעקטיישאַנז - טאַקע יקסידיד עקספּעקטיישאַנז
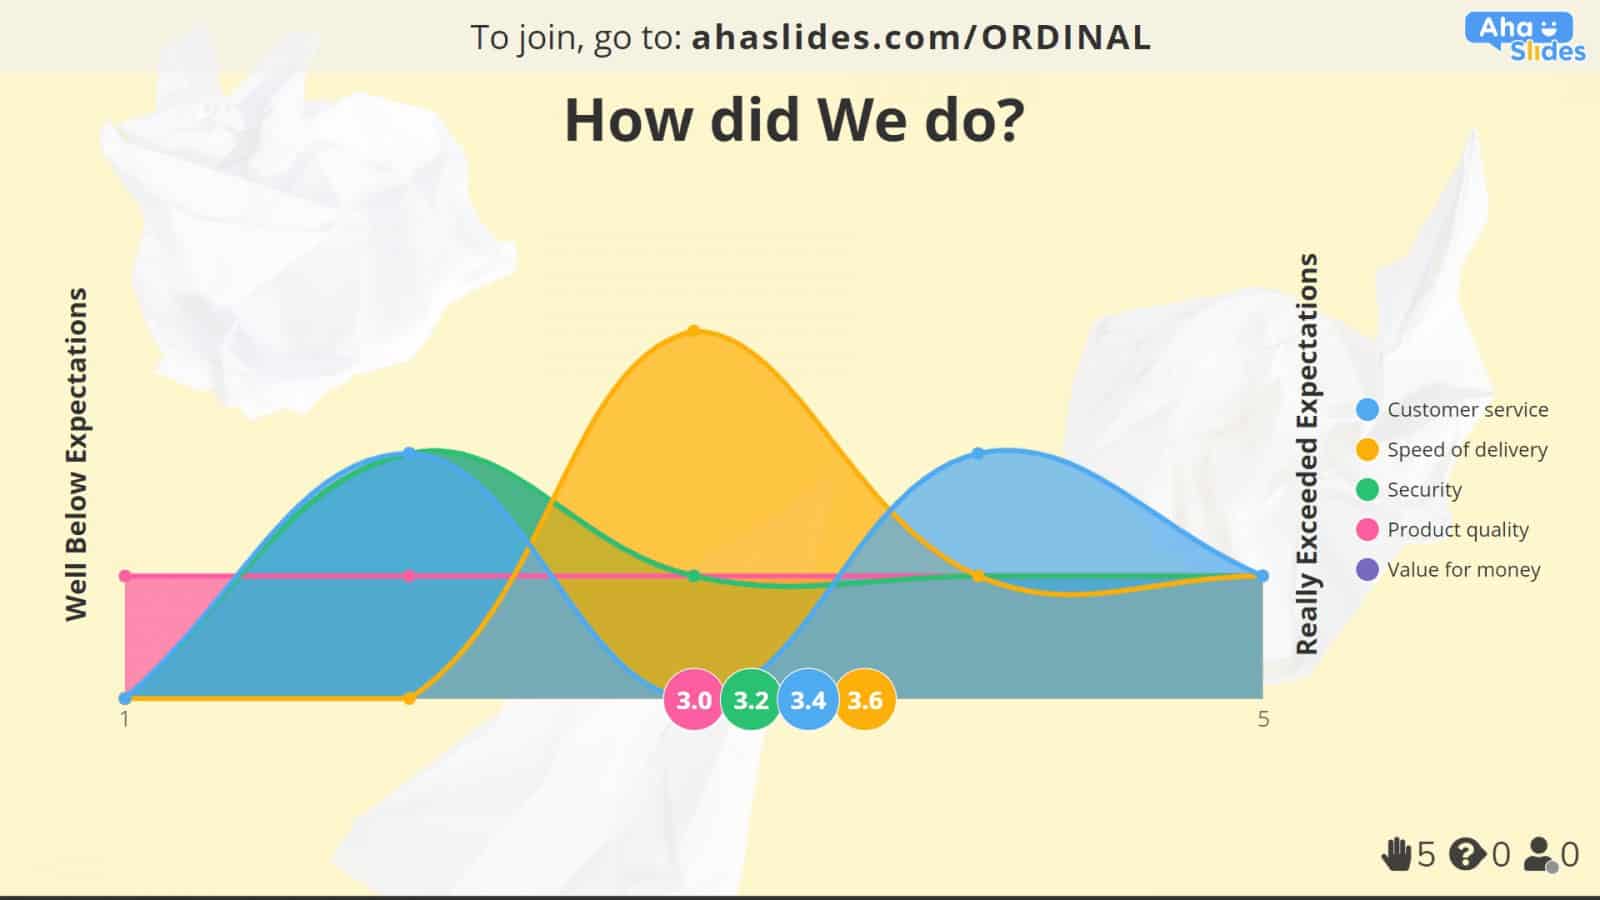
פּערפאָרמאַנסע אָרדאַנאַל סקאַלעס זענען זייער ווי צופֿרידנקייט אָרדאַנאַל סקאַלעס, וואָס מעסטן די קוילעלדיק יפעקטיוונאַס און עפעקטיווקייַט פון אַ דינסט. אָבער, די סאַטאַל חילוק איז אַז דעם טיפּ פון אָרדאַנאַל וואָג טענדז צו מעסטן די לעצט פאָרשטעלונג אין באַציונג צו עמעצער ס פּרידיטערמינד עקספּעקטיישאַנז פון אַז דינסט.
עטלעכע ביישפילן פון פאָרשטעלונג אָרדאַנאַל סקאַלע:
- א פירמע צונויפקום קונה איבערבליקן פון יעדער אַספּעקט פון זייער קויפן און עקספּרעס. זיי קענען נוצן די דאַטן צו זען וווּ די קאַסטאַמערז שטעלן הויך עקספּעקטיישאַנז און וווּ די פירמע קען נישט טרעפן זיי.
- א פילם סטודיאָ וואָס געפרוווט צו געפֿינען זיך אויב זייער לעצט פּראָדוקציע איז געווען אַפּרישיייטיד. אויב ניט, עס איז מעגלעך אַז דער פילם איז געווען אָוווערפּאַנדיד פריער אָדער אַז ער קען נישט צושטעלן אָדער ביידע.
טיפּ # 8 - ליקעליהאָאָד
[בכלל נישט – מסתמא נישט – אפשר – מסתמא – אוודאי
ליקעליהאָאָד אָרדינאַל סקאַלעס זענען אַ גרויס וועג צו רעכענען אויס ווי מסתּמא אָדער אַנלייקלי אַ מענטש וועט נעמען אַ דערמאנטע אַקציע אין דער צוקונפֿט. דאָס איז אָפט נאָך באַגעגעניש פון עטלעכע באדינגונגען, אַזאַ ווי אַ טראַנסאַקטיאָן אָדער אַ מעדיציניש פּראָצעדור איז געענדיקט.
עטלעכע ביישפילן פון ליקעליהאָאָד אָרדאַנאַל סקאַלע:
- א פירמע טריינג צו באַשליסן וואָס פּראָצענט פון זייער קאַסטאַמערז וועט ווערן אַדוואַקאַץ פון די סאָרט נאָך ניצן די דינסט. דאָס וועט אַנטדעקן אינפֿאָרמאַציע וואָס קענען העלפֿן בויען סאָרט לויאַלטי איבער קייפל טשאַנאַלז.
- א מעדיציניש יבערבליק פֿאַר דאקטוירים וואָס באַשליסן די ליקעליהאָאָד פון זיי פּריסקרייבד אַ זיכער טיפּ פון מעדאַקיישאַן נאָך ניצן עס פֿאַר די ערשטער מאָל. די דאַטן וועט העלפן פאַרמאַסוטיקאַל קאָמפּאַניעס אַנטוויקלען קרעדיביליטי פֿאַר זייער מעדיצין.
טיפּ # 9 - פֿאַרבעסערונג
[דראמאטיש פארערגערט - פארערגערט - געבליבן דער זעלבער - פארבעסערט - דראמאטיש פארבעסערט]
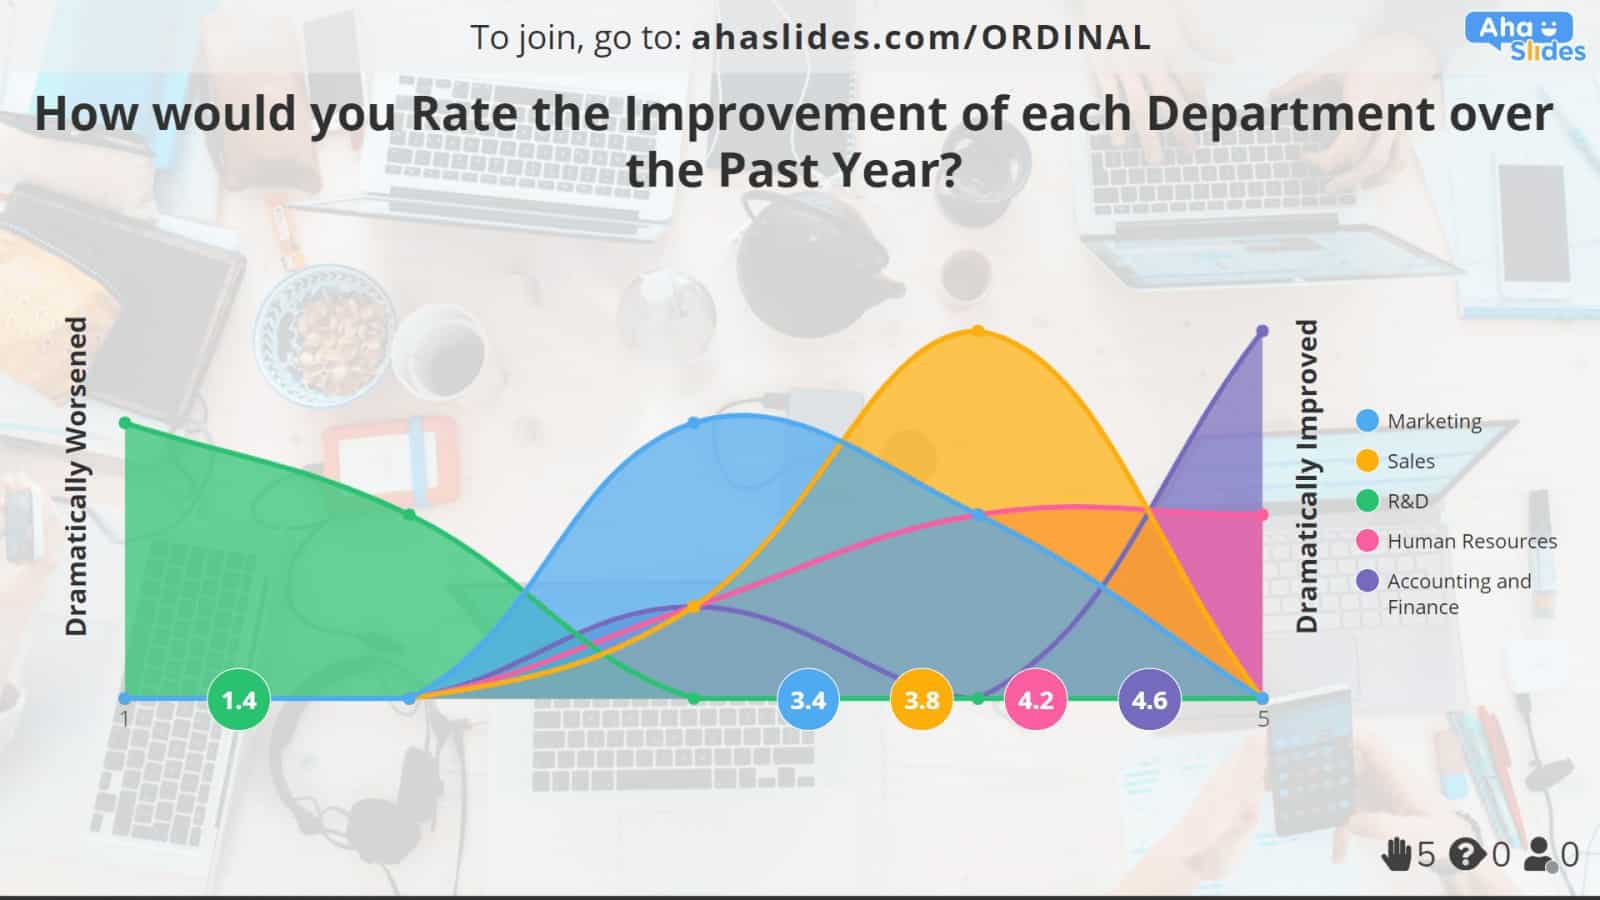
פֿאַרבעסערונג אָרדאַנאַל סקאַלעס צושטעלן אַ מעטריק אויף פּראָגרעס איבער אַ געוויסע צייט צייט. זיי מעסטן די מערקונג פון אַ יחיד אין וואָס גראַד די שטאַט פון ענינים האט ווערסאַנד אָדער ימפּרוווד נאָך אַ ענדערונג איז ימפּלאַמענאַד.
עטלעכע ביישפילן פון אָרדאַנאַל וואָג ביישפילן:
- א פירמע וואס פרעגט די מיינונגען פון זייערע אָנגעשטעלטע וועגן וועלכע דיפּאַרטמענטן האָבן זיך פאַרערגערט אָדער פארבעסערט אין די לעצטע יאָר. דאָס וועט העלפֿן זיי צו מאַכן מער מינינגפאַל השתדלות צו פּראָגרעס אין זיכער געביטן.
- א קלימאַטאָלאָגיסט וואָס האָט דורכגעקאָכט פאָרשונג וועגן דער מערקונג פון די פּובליק פון קלימאַט ענדערונג אין די לעצטע 10 יאָר. צונויפקום דעם טיפּ פון דאַטן איז קריטיש צו טשאַנגינג אַטאַטודז צו באַשיצן די סוויווע.
טיפּ # 10 - זיך פיייקייַט
[גאַנץ אָנהייבער - אָנהייבער - פאַר-ינטערמידייט - ינטערמעדיאַטע - פּאָסט-ינטערמעדיאַטע - אַוואַנסירטע - גאַנץ מומחה]
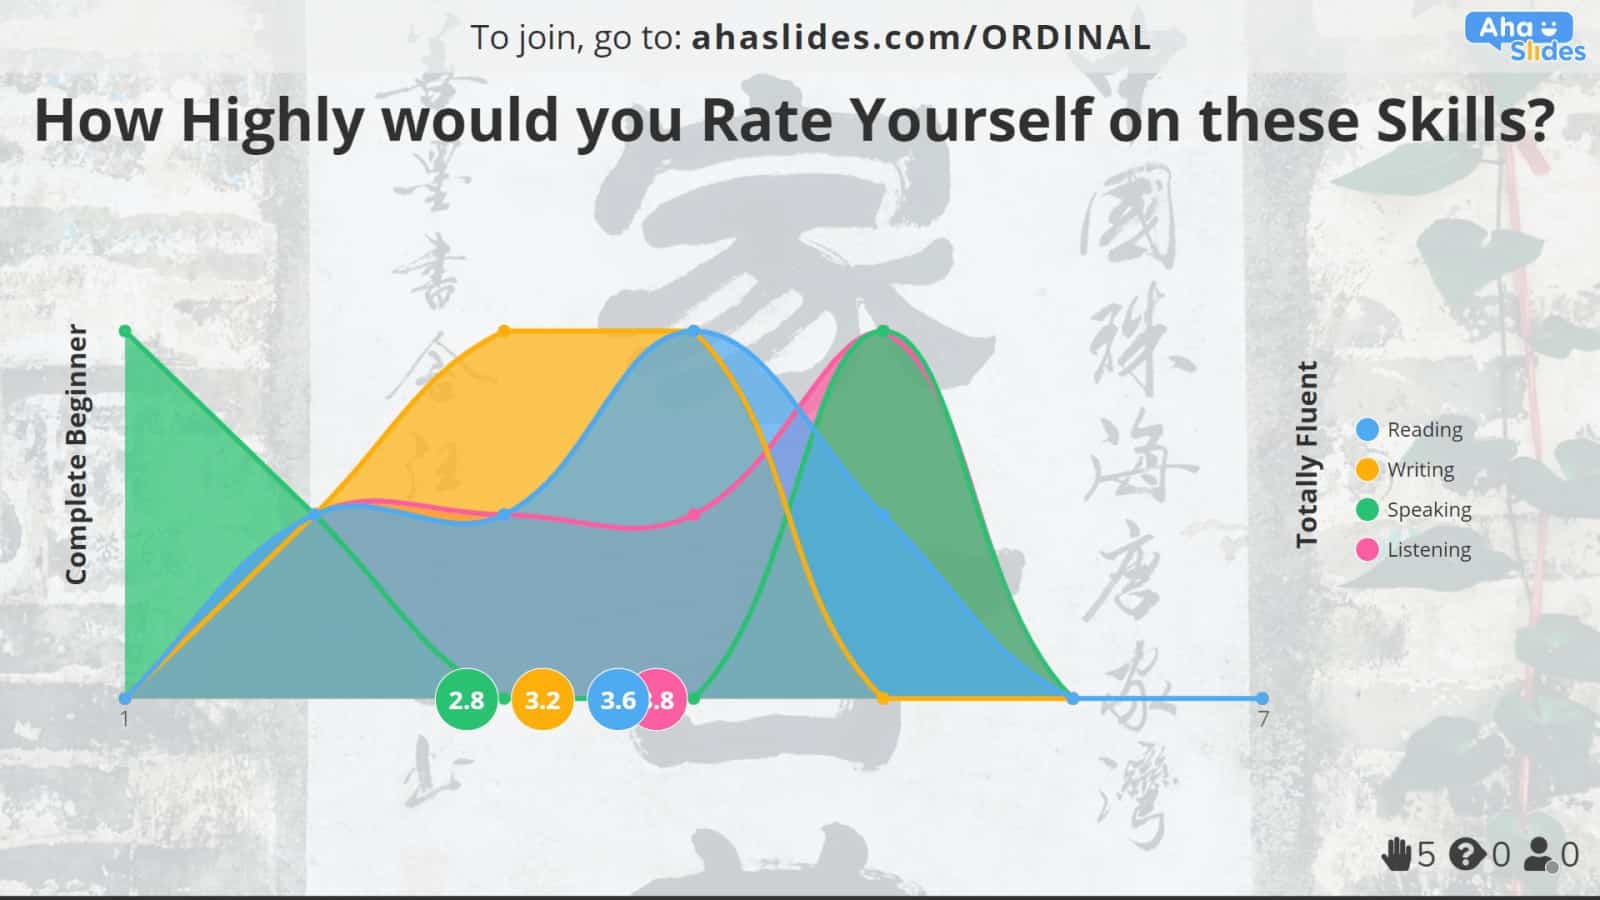
אָרדאַנאַל וואָג פון זיך-פיייקייַט קענען זיין זייער טשיקאַווע. זיי מעסטן עמעצער ס באמערקט מדרגה פון קאַמפּאַטינס אין אַ זיכער אַרבעטוואָס מיינט אַז זיי קענען זיין וויידלי דיפּענדינג אויף די הייך פון זיך-שאַצן אַז פאַרשידענע ריספּאַנדאַנץ אין אַ גרופּע האָבן.
עטלעכע ביישפילן פון זיך-פיייקייַט אָרדאַנאַל סקאַלע:
- א שפּראַך לערער טריינג צו באַשליסן ווי זיכער זייער סטודענטן זענען אין עטלעכע געביטן פון שפּראַך פיייקייט. דער לערער קענען טאָן דאָס איידער אָדער נאָך אַ לעקציע אָדער לויף צו באַשליסן די פֿאַרבעסערונג פון די זעלבסט-באמערקט פיייקייט איבער צייט.
- אַן ינטערוויעווער אַסקינג קאַנדאַדייץ וועגן זייערע סטרענגטס און וויקנאַסאַז בעשאַס אַן אַרבעט אינטערוויו. אויב איר טאָן דאָס, דאָס קען העלפֿן די רעכט קאַנדידאַט פֿאַר די אַרבעט.
אָרדינאַל וואָג קעגן אנדערע טייפּס פון וואָג

איצט ווען מיר האָבן דורכגעקאָכט עטלעכע ביישפילן פון אָרדענונג וואָג, איר קען זיין וואַנדערינג ווי די אָרדאַנאַל וואָג פֿאָרמאַט איז אַנדערש פון אנדערע וואָג.
יוזשאַוואַלי ווען מיר רעדן וועגן אָרדאַנאַל וואָג, מיר רעדן וועגן זיי אין דער זעלביקער אָטעם ווי די פיר וואָג פון מעאַסורעמענט, וואָס זענען:
- נאָמינאַל וואָג
- אָרדינאַל וואָג
- ינטערוואַל וואָג
- פאַרהעלטעניש וואָג
זאל ס נעמען אַ קוק אין ווי די אָרדאַנאַל וואָג ביישפילן מיר ווע פּונקט געזען קאַמפּערד צו די אנדערע 3 טייפּס פון וואָג ...
אָרדאַנאַל סקאַלע עקסאַמפּלע ווס נאָמינאַל סקאַלע עקסאַמפּלע
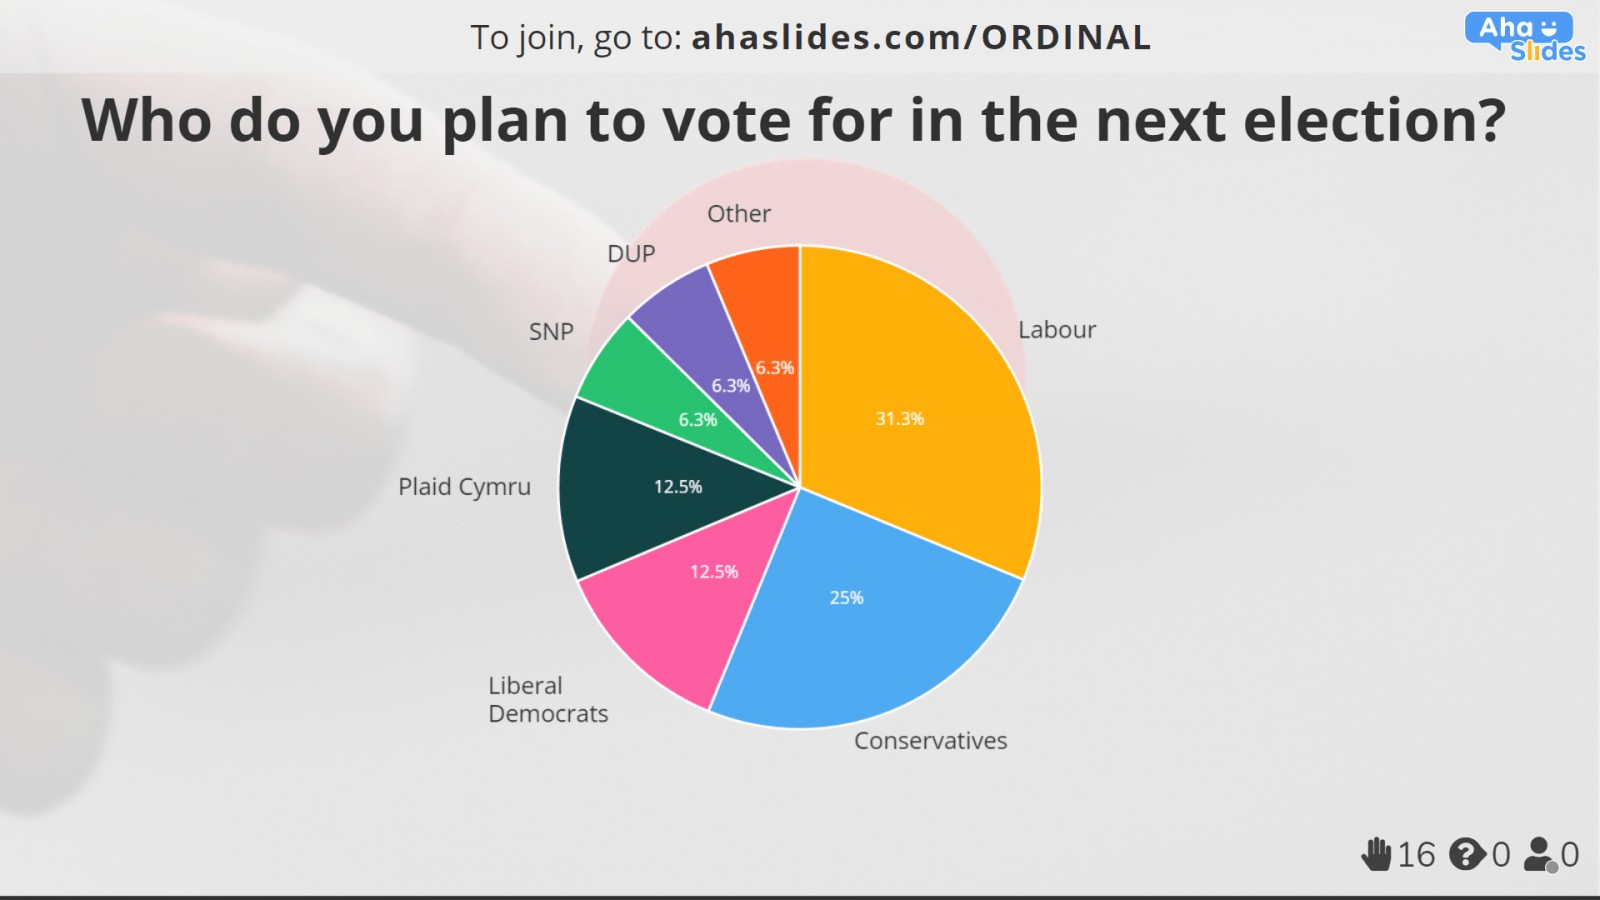
א נאָמינאַל וואָג אָדער נאָמינאַל פראגעס אין אַ יבערבליק, איז אַנדערש פון אַ אָרדאַנאַל וואָג אין די וועג אַז זייַן וואַלועס האָבן קיין סדר צו זיי.
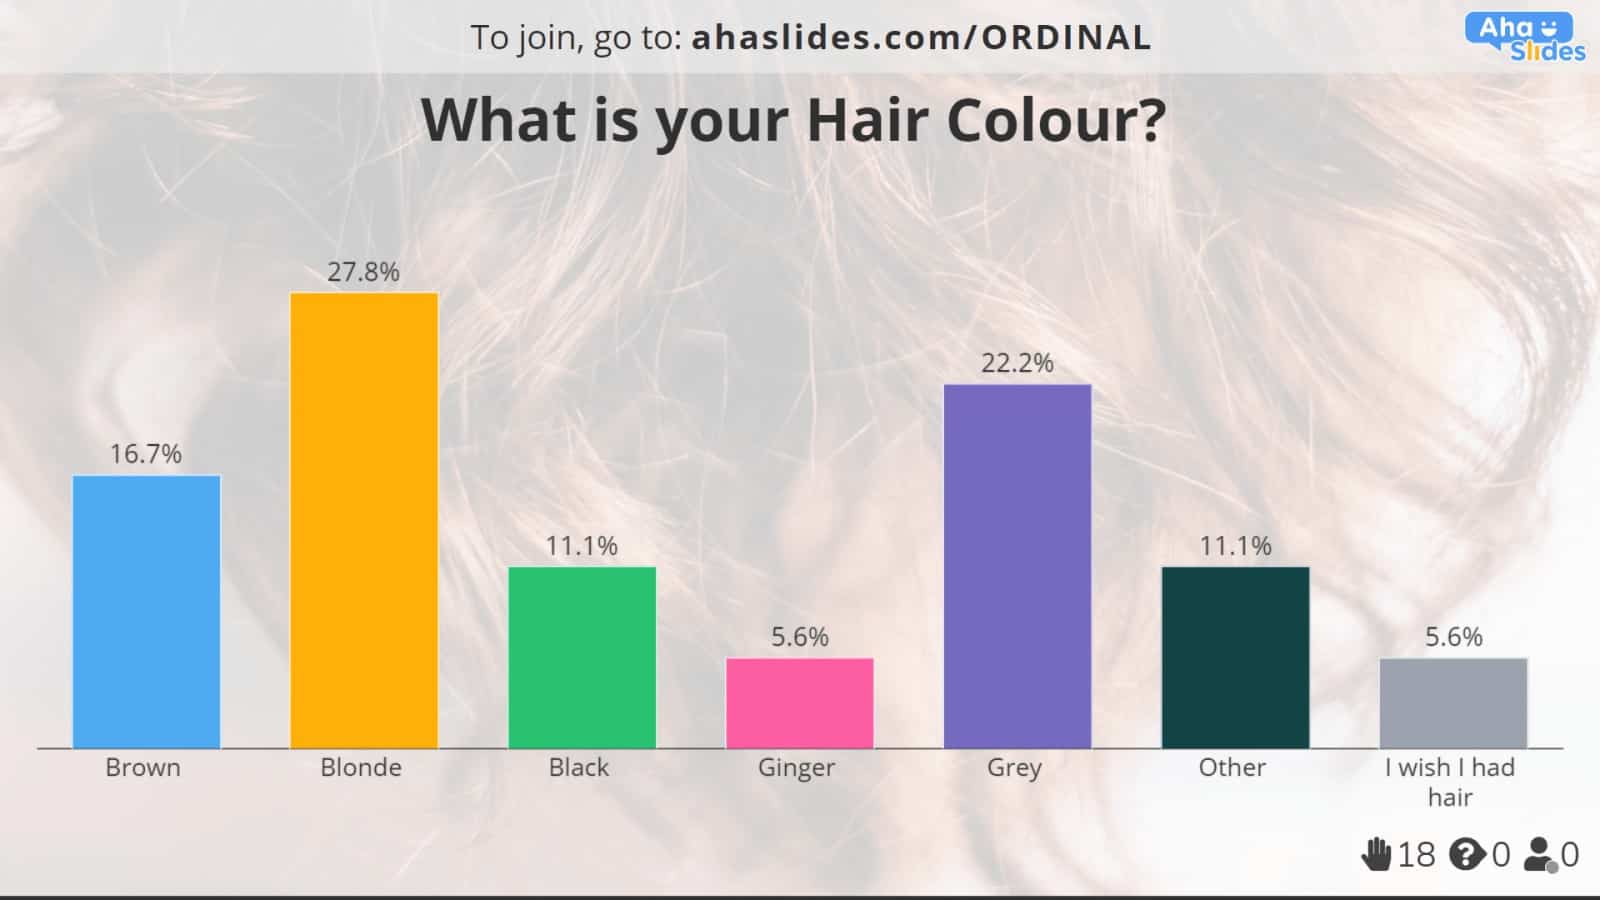
דאָ ס אַ בייַשפּיל: איך קלייַבן עטלעכע פּשוט פאָרשונג דאַטן וועגן האָר קאָליר. אויב איך נוצן אַ נאָמינאַל וואָג, די וואַלועס וועט זיין פשוט אַנדערש אין האָר פארבן (ברוין, בלאָנדע, שוואַרץ, אאז"ו ו.) באַמערקונג אַז עס איז קיין סדר דאָ; עס ס ניט ווי ברוין פירט צו בלאָנדע וואָס פירט צו שוואַרץ און ווייַטער.
אויב איך נוצן אַן אָרדענונג וואָג, איך קען לייגן וואַלועס פֿאַר די לייטנאַס אָדער פינצטערניש פון די האָר האט אַ סדר (ליכט פירט צו טונקל).
דאָ ס אַ נאָמינאַל וואָג בייַשפּיל וועגן האָר קאָליר
און דאָ ס אַן אָרדינאַל וואָג בייַשפּיל וועגן האָר קאָליר:
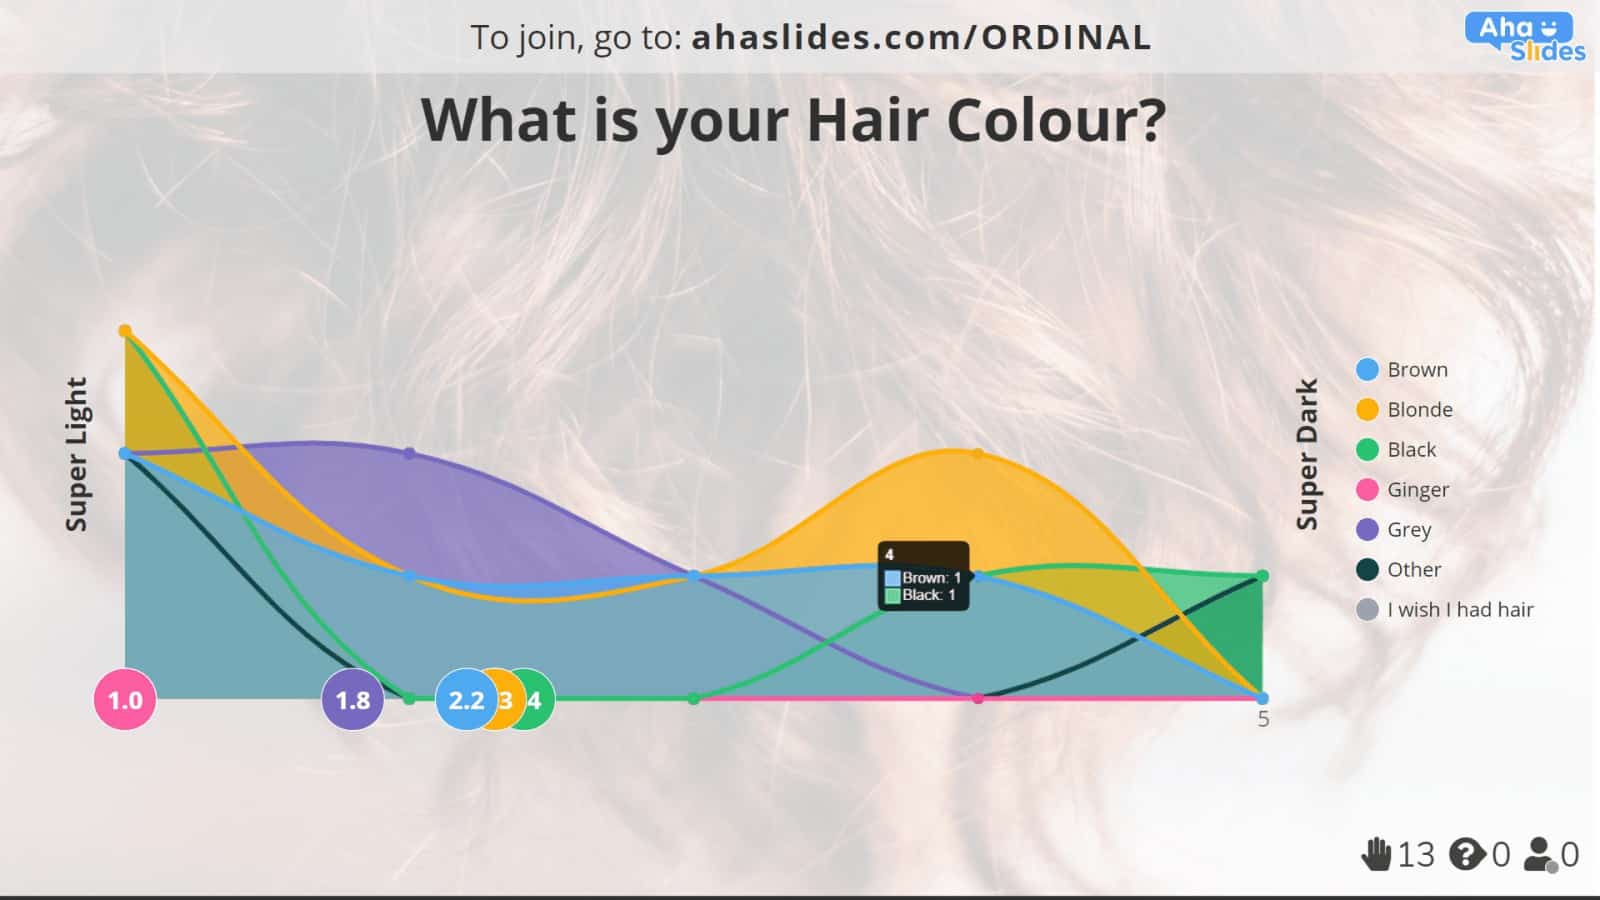
אין דעם וועג, די אָרדאַנאַל וואָג ביישפּיל איז געבן אונדז עקסטרע אינפֿאָרמאַציע. ניט בלויז עס אַנטדעקן ווי פילע ריספּאַנדאַנץ פון יעדער האָר קאָליר מיר האָבן (איר קענען האָווער די מויז איבער קיין קייַלעכיק פונט צו זען ווי פילע רעספּאָנסעס עס גאַט), אָבער מיר קענען אויך זען די לייטנאַס אָדער פינצטערניש פון די האָר פארבן אויף אַ 5- פונט וואָג צווישן 'סופּער ליכט' (1) און 'סופּער פינצטער' (5).
טאן טינגז אויף די אָרדענונג וואָג איז גרויס פֿאַר קאַלעקטינג אן אנדער פּלאַסט פון אינפֿאָרמאַציע. אָבער, איר קען לויפן אין עטלעכע ישוז אַז די נאָמינאַל און אָרדאַנאַל וואַלועס טאָן ניט גלייַכן זיך. פֿאַר בייַשפּיל, ווי קען אַ מענטש מיט שוואַרץ האָר אויך האָבן 'סופּער ליכט' האָר? און וואָס ווערט קען אַ מענטש אָן האָר קלייַבן?
איר קענען אַדרעס די ישוז מיט אַ פּאָר פון פּשוט וואָרקאַראָונדס: איין וועג איז צו לאָזן אַ אָנזאָג פֿאַר ריספּאַנדאַנץ אַז ילימאַנייץ די שאַנס פון מעסינג די וואַלועס:

- אן אנדער וועג איז צו לאָזן די לאָואַסט ווערט (1) ווי N / A (ניט אָנווענדלעך). רעספּאָנדענץ וואָס קענען פאַרבינדן צו די נאָמינאַל וואָג אָבער נישט די אָרדאַנאַל וואָג קענען קלייַבן N/A צו ענשור אַז עס איז קיין ווערט קאָנפליקט. דער 'סופּער ליכט' ווערט וועט דעריבער אָנהייבן אויף (2).

אָרדאַנאַל סקאַלע ביישפילן קעגן ינטערוואַל סקאַלע ביישפילן
פּונקט ווי אַן אָרדינאַל וואָג ריווילז מער דאַטן ווי אַ נאָמינאַל וואָג, אַ ינטערוואַל וואָג ריווילז אפילו מער ווי אַז. אַ מעהאַלעך וואָג איז זארגן מיט די גראַד פון חילוק צווישן די וואַלועס. אַזוי, לאָזן אונדז זען עטלעכע ביישפילן פון ינטערוואַל וואָג און ביישפילן פון ינטערוואַל קשיא.
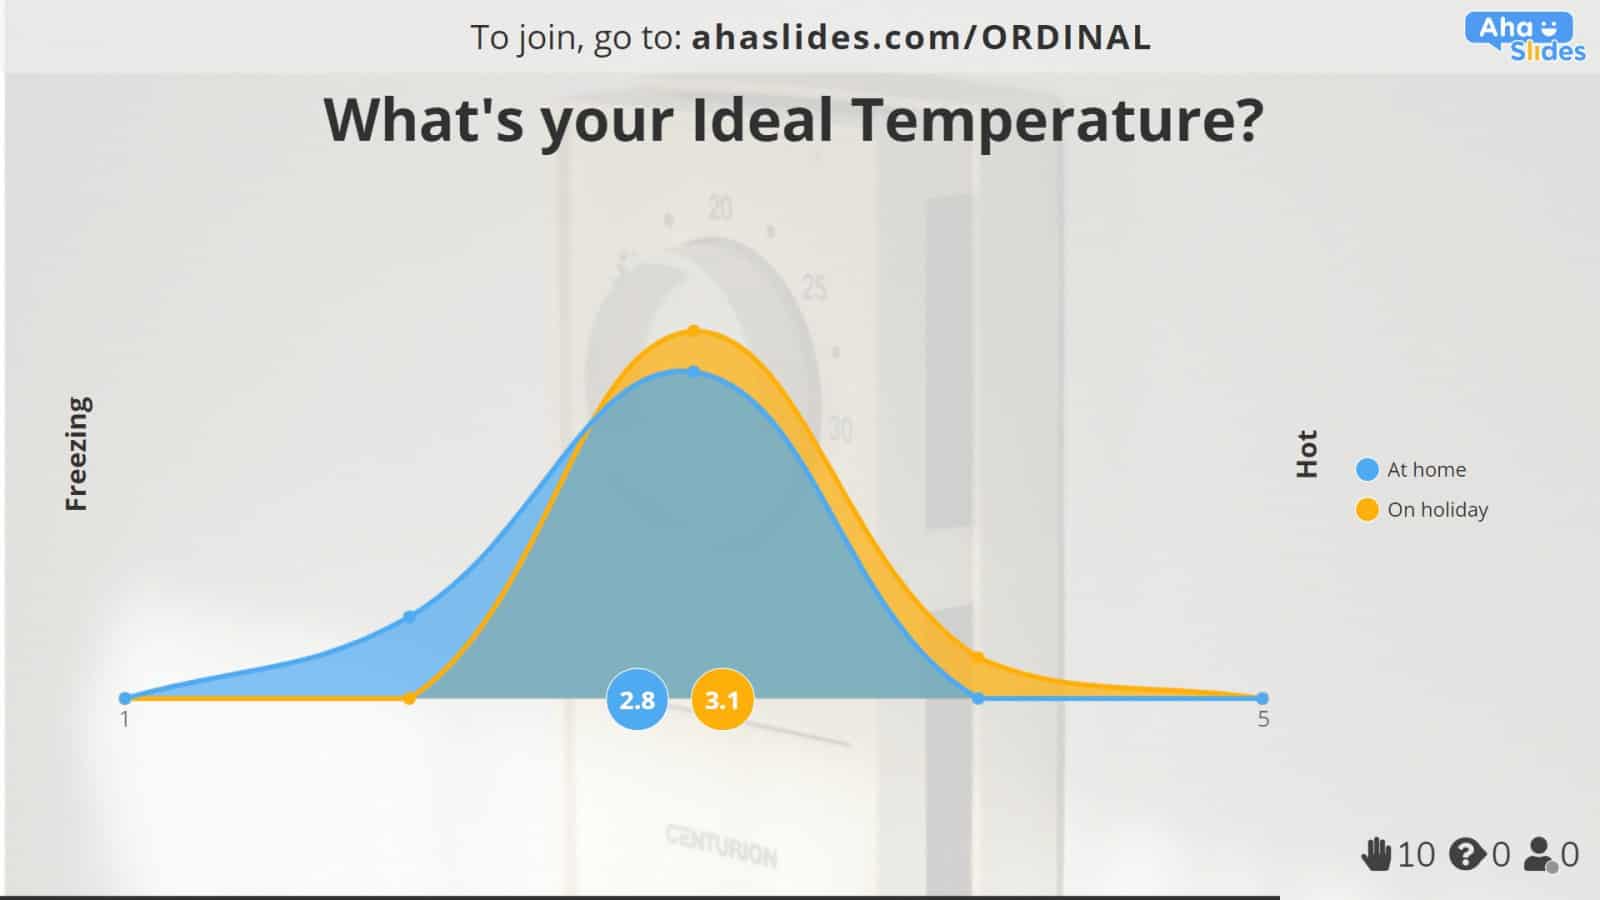
אַזוי, לאָמיר זאָגן איך טאָן מער פּשוט פאָרשונג, דאָס מאָל אין די ידעאַל טעמפּעראַטור פון מענטשן אין שטוב און אויף יום טוּב. אין אַ אָרדאַנאַל וואָג פֿאָרמאַט, איך וואָלט שטעלן מיין וואַלועס ווי דאָס:
- ייַז קאַלט
- קאַלט
- טעמפּעראַט
- וואַרעם
- הייס
דער גרויס פּראָבלעם מיט דעם אָרדענונג וואָג ביישפּיל איז אַז דאָס איז גאָר סאַבדזשעקטיוו. וואָס איז גערעכנט ווי 'ייַז קאַלט' פֿאַר עמעצער קען זיין גערעכנט ווי 'טעמפּעראַט' פֿאַר עמעצער אַנדערש.
לויט די ווערטער פון די וואַלועס, אַלעמען וועט געוויינטלעך גראַוויטייט צו די מיטל. דאָס איז ווו די ווערטער שוין פֿאָרשלאָגן די ידעאַל טעמפּעראַטור, און עס פירט צו אַ גראַפיק וואָס קוקט ווי דאָס:
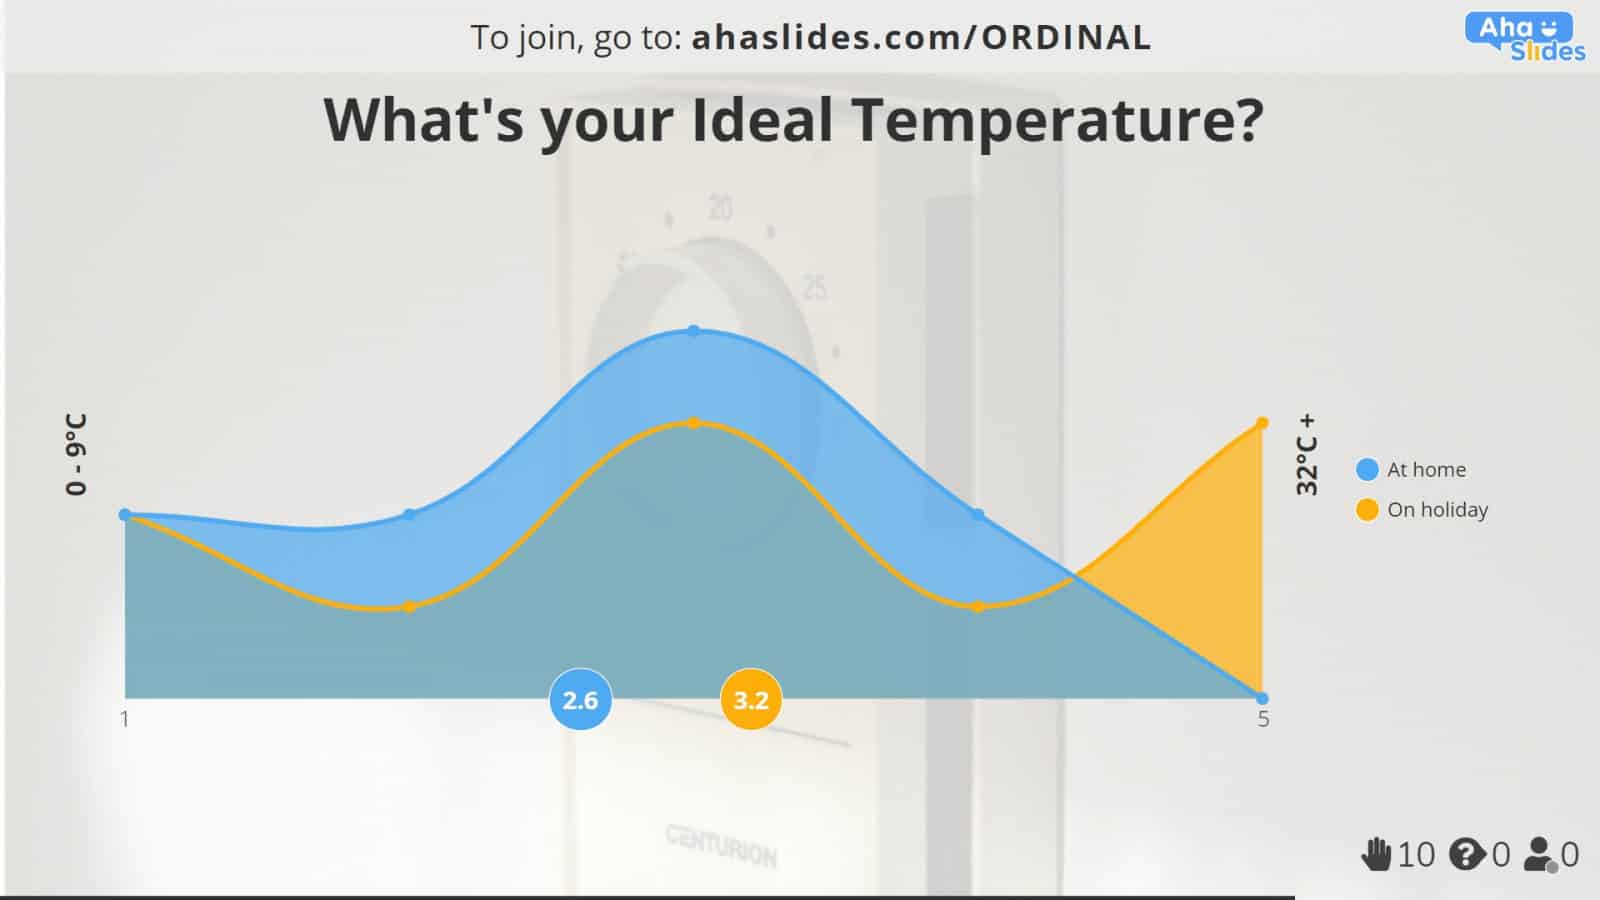
אַנשטאָט, איך זאָל נוצן אַ מעהאַלעך וואָג וואָס וועט נאָמען די פּינטלעך דיגריז אין סעלסיוס אָדער פאַהרענהעיט וואָס שטימען צו יעדער ווערט, ווי אַזוי:
- פריזינג (0 ° C - 9 ° C)
- קאַלט (10 ° C - 19 ° C)
- טעמפּעראַט (20 ° C - 25 ° C)
- וואַרעם (26 ° C - 31 ° C)
- הייס (32 ° C +)
באַשטעטיקן די וואַלועס אויף דעם וועג מיטל אַז מיין ריספּאַנדאַנץ קענען מאַכן זייער דיסיזשאַנז באזירט אויף אַן יגזיסטינג און געזונט-באַוווסט סקיילינג סיסטעם, אלא ווי די בייאַסט פּערסעפּשאַנז פון ווער עס יז געשריבן די קשיא.
איר קענט אויך באַקומען באַפרייַען פון די ווערדינג גאָר, אַזוי אַז ריספּאַנדאַנץ זענען נישט ינפלואַנסט דורך פּריסקרייבד געדאנקען געבראכט דורך די שטאַרקייט פון די ווערטער.
טאן דעם מיטל אַז רעזולטאַטן זענען געבונדן צו זיין מער וועריד און פּינטלעך, אזוי
אָרדאַנאַל סקאַלע בייַשפּיל ווס פאַרהעלטעניש סקאַלע בייַשפּיל
א פאַרהעלטעניש וואָג איז ענלעך צו אַ ינטערוואַל וואָג ווי עס פאָוקיסיז אויף נומערן און די דיפעראַנסיז צווישן זיי.
די איין גרויסע חילוק איז אָבער די בייַזייַן אין אַ פאַרהעלטעניש וואָג פון די 'אמת נול' ווערט. דעם 'אמת נול' איז די גאַנץ אַוועק פון די ווערט מעזשערד.
פֿאַר בייַשפּיל, נעמען אַ קוק אין דעם פאַרהעלטעניש וואָג אויף אַרבעט דערפאַרונג

איר קענען זען אַז דעם פאַרהעלטעניש וואָג ביישפּיל סטאַרץ מיט די ווערט פון '0 יאָרן', וואָס רעפּראַזענץ די גאַנץ אַוועק פון קיין אַרבעט דערפאַרונג. דעם מיטל אַז איר האָבן אַ האַרט, ימווואַבאַל יסוד פון וואָס צו אָנהייבן דיין אַנאַליסיס.
געדענקען: ניט אַלע נול וואַלועס זענען 'אמת נול'. די 0 ° C ווערט פון אונדזער מעהאַלעך וואָג איז נישט אַ אמת נול ווייַל 0 ° C איז אַ ספּעציפיש טעמפּעראַטור, ניט דער אַוועק פון טעמפּעראַטור.
אנדערע וועגן צו באַקומען
דו זאלסט נישט פאַרפירן אונדז פאַלש דאָ; אָרדאַנאַל וואָג איז טאַקע גרויס. אבער צו מאַכן אַ באמת ענגיידזשינג יבערבליק אין די פעלדער פון בילדונג, אַרבעט, פּאָליטיק, פּסיכאָלאָגיע, אָדער עפּעס אַנדערש, איר וועט וועלן צו ויסטיילן דעם פֿאָרמאַט.
מיט AhaSlides, איר האָט אַ פּלאַץ פון וועגן צו באַקומען דיין וילעם!
1. קייפל אַנקעטע
קייפל פּאָללס זענען די סטאַנדאַרט סאָרט פון אַנקעטע און זענען בארעכטיגט אין באַר, פּעמפּיקל אָדער פּיראָג טשאַרט פאָרעם. פשוט שרייבן די ברירות און לאָזן דיין וילעם קלייַבן!
2. בילד ברירה אָפּשטימונג
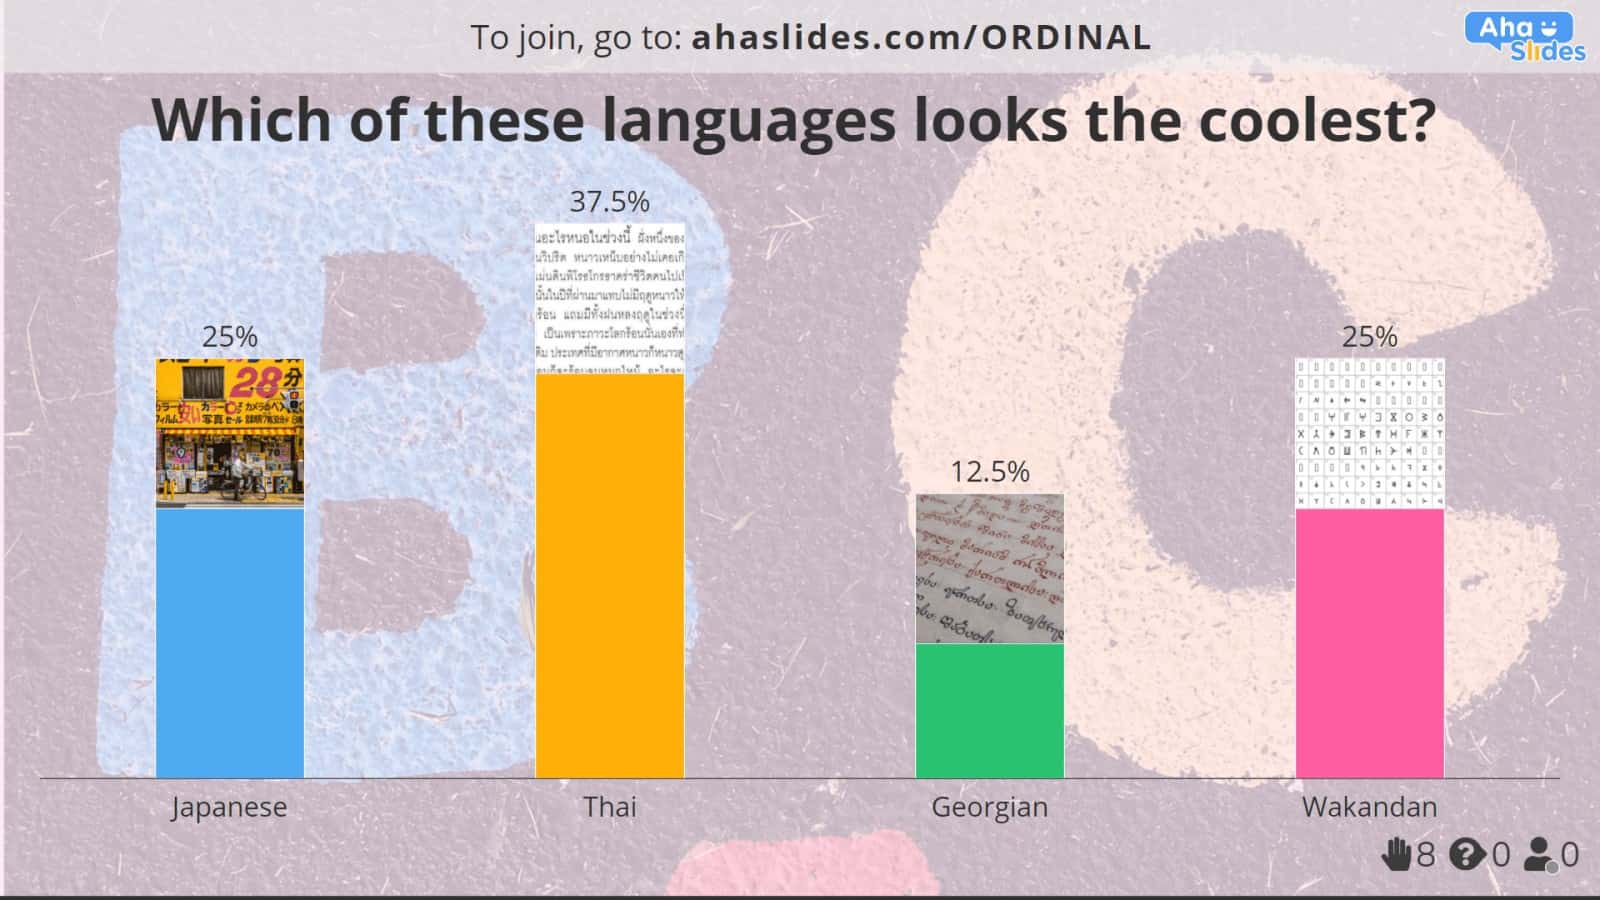
בילד ברירה ברירה פּאָללס אַרבעט די זעלבע וועג ווי קייפל ברירה פּאָללס, נאָר מער וויזשאַוואַל!
3. וואָרט קלאָוד באַקומען
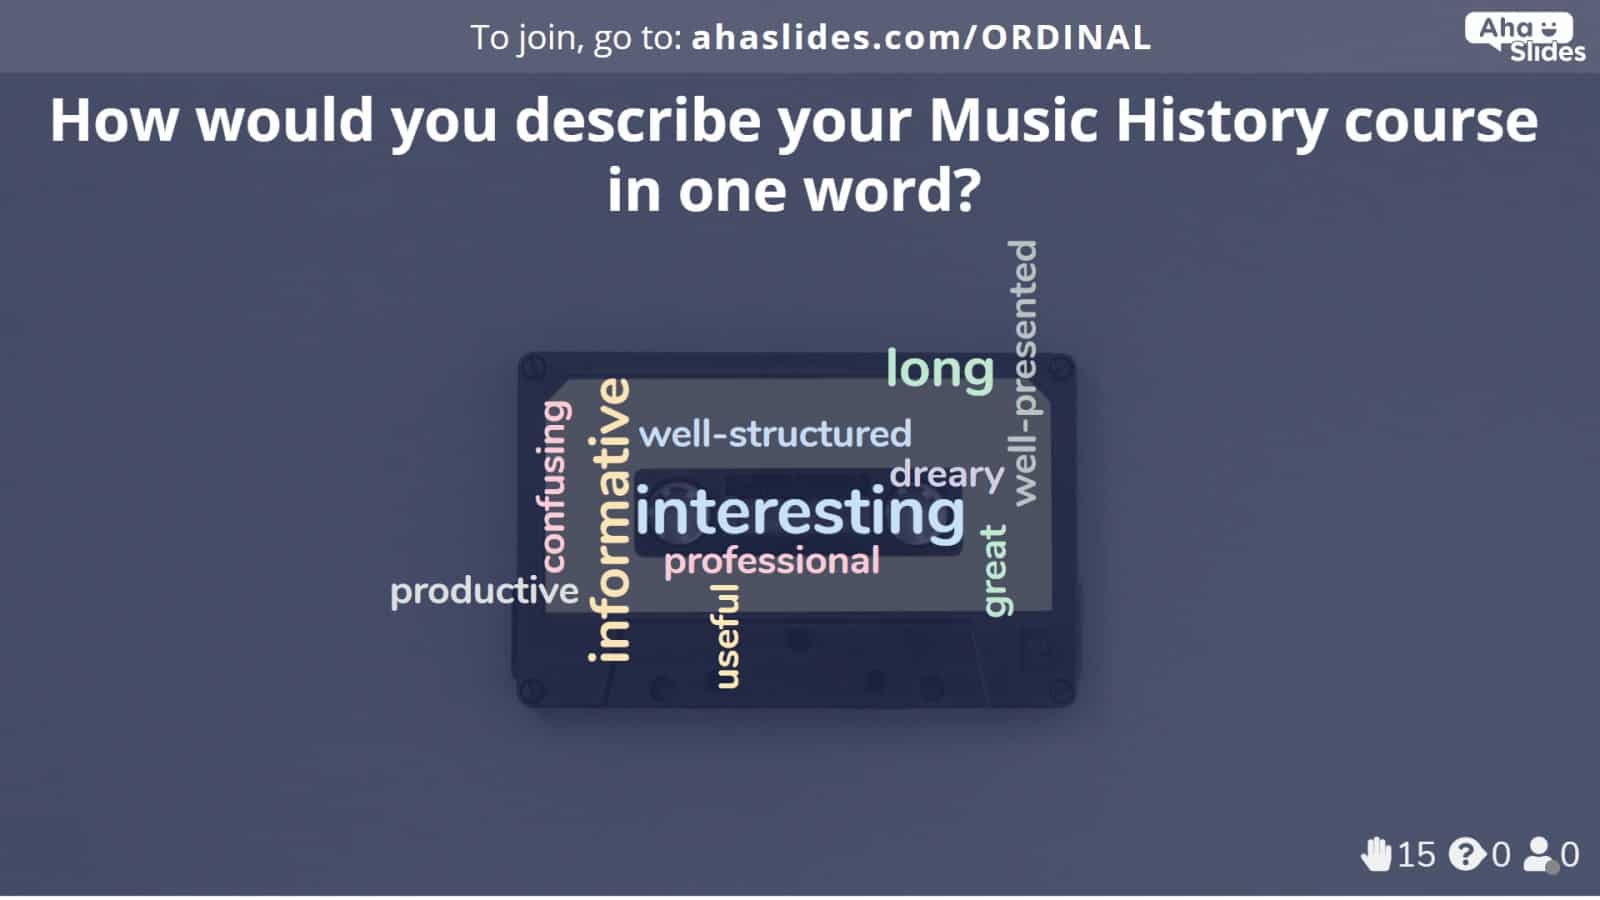
וואָרט וואלקנס זענען קורץ רעספּאָנסעס אויף אַ טעמע, יוזשאַוואַלי איין אָדער צוויי ווערטער לאַנג. די מערסט פאָלקס ענטפֿערס צווישן ריספּאַנדאַנץ דערשייַנען אין דעם צענטער אין גרעסערע טעקסט, בשעת ווייניקער פאָלקס ענטפֿערס זענען געשריבן אין קלענערער טעקסט אַרויס די צענטער פון די רוק.
4. אָפֿן-ענדעד אַנקעטע
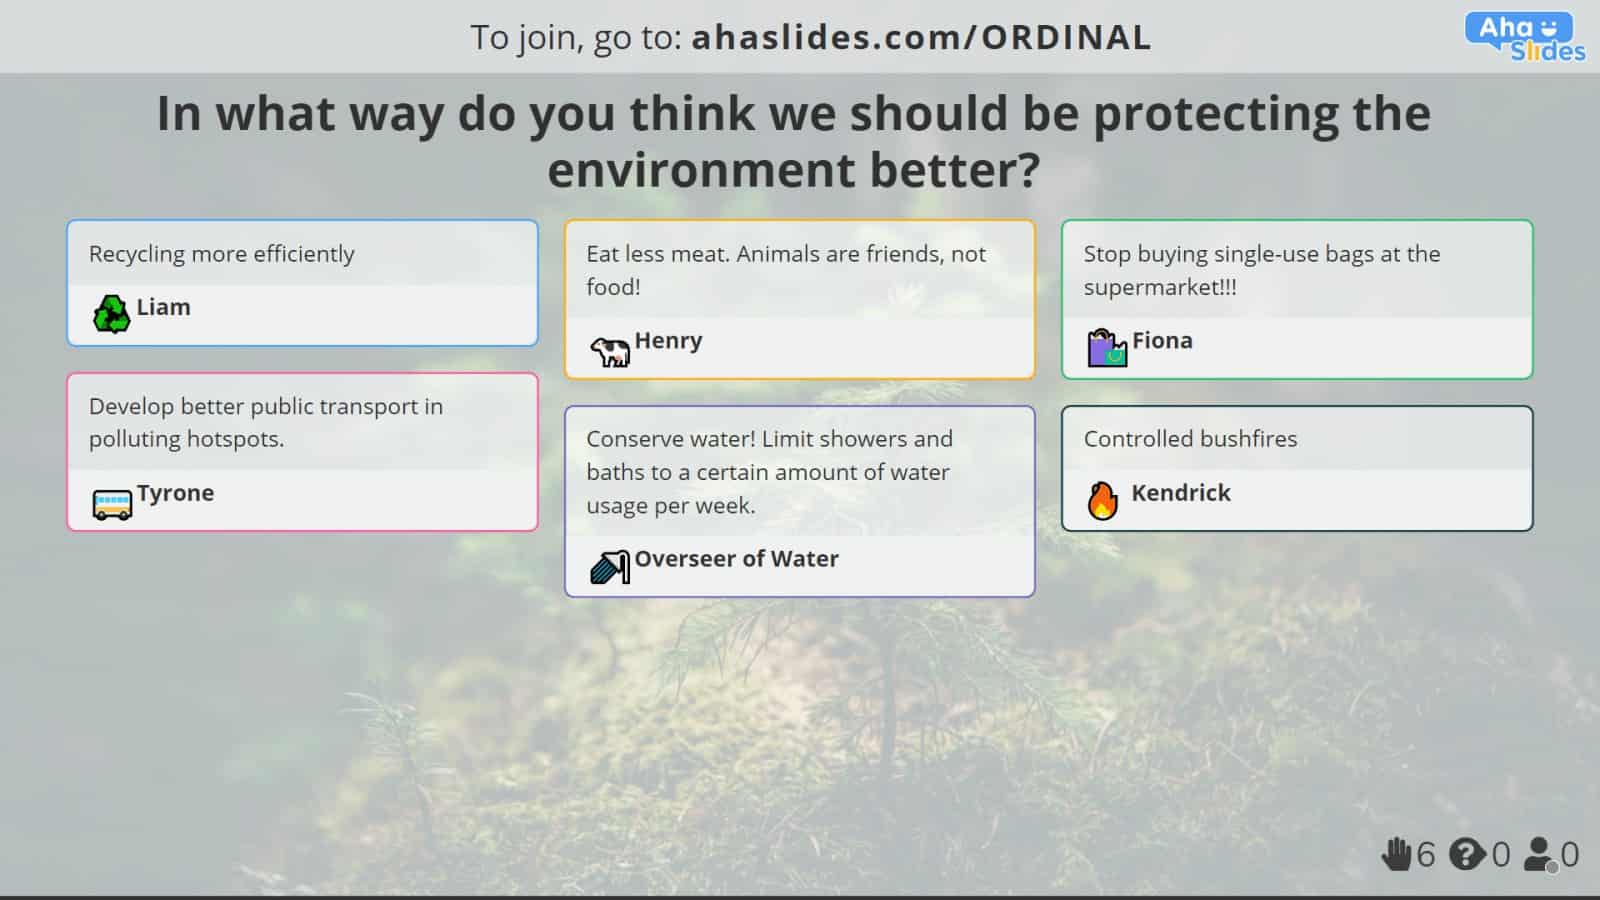
עפענען-געענדיקט אַנקעטע העלפּס איר צו זאַמלען ענטפֿערס מיט שעפֿערישקייט און פרייהייט. עס איז קיין קייפל-ברירה אָדער וואָרט שיעור; די טייפּס פון פּאָללס מוטיקן לאַנג-פאָרעם ענטפֿערס וואָס גיין אין דעטאַל.
די שליימעסדיק אָנליין פּאָללינג געצייַג
אַלץ וואָס איז דערלאנגט אין דעם אַרטיקל - ביישפילן פון די אָרדאַנאַל וואָג, די ביישפילן פון די נאָמינאַל, ינטערוואַל און פאַרהעלטעניש וואָג, ווי אויך די אנדערע טייפּס פון פּאָללס, זענען אַלע געמאכט אויף AhaSlides.
אַהאַסלידעס איז אַ פריי דיגיטאַל געצייַג וואָס איז סופּער ינטואַטיוו און פלעקסאַבאַל! עס איז אַן אָנליין ווייכווארג וואָס אַלאַוז איר צו זאַמלען אינפֿאָרמאַציע און מיינונגען פון אַלע איבער די וועלט. איר קענט לאָזן דיין יבערבליק אָפן, אַזוי אַז דיין ריספּאַנדאַנץ קענען נעמען עס אָן איר אפילו דאָרט!
דורך די 'סקאַלעס' רוק, AhaSlides אַלאַוז איר צו שאַפֿן אָרדאַנאַל וואָג אין אַ קייט פון סטייטמאַנץ אין 3 פּשוט טריט:
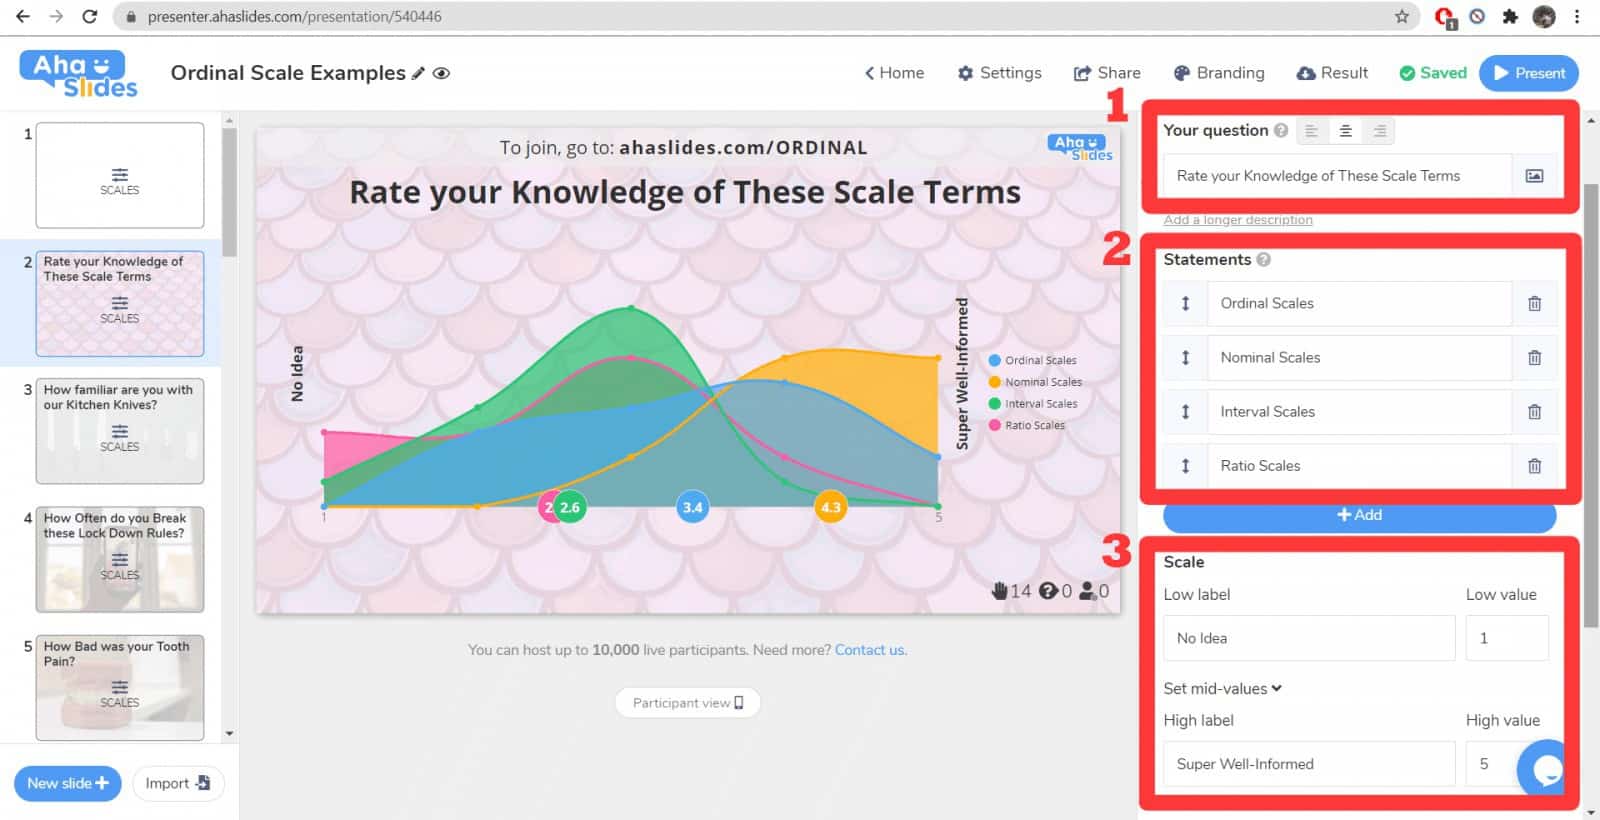
- שרייב דיין קשיא
- שטעלן דיין סטייטמאַנץ
- לייג אין די וואַלועס
טיפּ די פאַרבינדן קאָד אין די שפּיץ פון די רוק פֿאַר דיין באַטייליקטער צו זען. אַמאָל זיי אַרייַן די קאָד אויף זייער פאָנעס, זיי וועלן קענען צו ענטפֿערן די קשיא אויף דיין אָרדאַנאַל וואָג, דורך סלידערס, אַריבער אַלע סטייטמאַנץ.
די ענטפער דאַטן פון דיין וילעם וועט בלייבן אויף דיין פּרעזענטירונג סייַדן איר קלייַבן צו מעקן עס, אַזוי די אָרדאַנאַל מדרגה דאַטן איז שטענדיק בנימצא. איר קענט דערנאָך טיילן דיין פּרעזענטירונג און זיין ענטפער דאַטן ערגעץ אָנליין.
אויב איר ווילט צו שאַפֿן דיין אייגענע אָרדענונג וואָג, ווי געזונט ווי אַ פּלאַץ פון אנדערע טייפּס פון פּאָללס, דריקט דעם קנעפּל אונטן!
אָפֿט געשטעלטע פֿראגן
וואָס איז אַ אָרדאַנאַל וואָג?
אַ אָרדאַנאַל וואָג איז אַ טיפּ פון מעזשערמאַנט וואָג געניצט אין סטאַטיסטיק און פאָרשונג. עס אַלאַוז די ראַנג אָדער אָרדערינג פון דאַטן ווייזט באזירט אויף זייער קאָרעוו שטעלעס אָדער לעוועלס פון אַ באַזונדער כאַראַקטעריסטיש אָדער אַטריביוט.
אין אַ אָרדאַנאַל וואָג, די דאַטן פונקטן זענען עריינדזשד אין אַ מינינגפאַל סדר, אָבער די דיפעראַנסיז צווישן די קאַטעגאָריעס אָדער רייען זענען נישט דאַווקע מונדיר אָדער קוואַנטיפייאַבאַל.
Top 4 שליסל פֿעיִקייטן פון אָרדאַנאַל וואָג?
שליסל פֿעיִקייטן פון אָרדאַנאַל וואָג: ראַנג, אָרדערס, נאָם-מונדיר דיפעראַנסיז, ביישפילן און לימיטעד אַריטמעטיק אַפּעריישאַנז. אָרדאַנאַל וואָג צושטעלן ווערטפול אינפֿאָרמאַציע וועגן די סדר אָדער ראַנג פון דאַטן ווייזט, אַלאַוינג פֿאַר קאַמפּעראַסאַנז און אַנאַליסיס באזירט אויף קאָרעוו שטעלעס. אָבער, זיי טאָן ניט צושטעלן גענוי מיטלען פון דיפעראַנסיז אָדער לאָזן מינינגפאַל מאַטאַמאַטיקאַל חשבונות.
וואָס זענען די דיפעראַנסיז צווישן די נאָמינאַל וואָג און אָרדאַנאַל וואָג?
די נאָמינאַל וואָג און אָרדאַנאַל וואָג זענען צוויי מעזשערמאַנט וואָג געניצט אין סטאַטיסטיק און פאָרשונג. זיי זענען אַנדערש אין די מדרגה פון אינפֿאָרמאַציע און די נאַטור פון די באַציונגען זיי קענען פאַרלייגן צווישן די דאַטן פונקטן.
וואָס איז אַ בייַשפּיל פון אַ אָרדאַנאַל וואָג?
איר קענען נוצן די אָרדאַנאַל וואָג פֿאַר פילע צוועקן, אַזאַ ווי רייטינג קונה צופֿרידנקייט ראַנג און גראַד, בילדונג קוואַליפיקאַציע און סאָסיאָ-עקאָנאָמיש סטאַטוס ...