



Most problem-solving meetings follow the same pattern. Someone names a symptom — "onboarding is too slow," "the project keeps going over budget," "customer complaints are up" — and the team spends the next 45 minutes debating whose fault it is without ever agreeing on why it's happening.
An Ishikawa diagram (also called a fishbone diagram or cause-and-effect diagram) is a structured way to break that cycle. Instead of jumping to solutions or blame, it maps every plausible cause of a problem before anyone decides what to do about it. The visual is deliberate: a horizontal arrow points to the problem on the right, and branches extend from it like the ribs of a fish, each one representing a category of causes.
This guide covers how the tool works, the standard categories used in workplace settings, and several concrete examples you can adapt for HR, L&D, and operations contexts.
Коротка історія
Kaoru Ishikawa developed the cause-and-effect diagram in 1943 while working with engineers at Kawasaki Steel Works, where he used it to help explain how a complex set of factors could interact to produce a single outcome [1]. He was a central figure in Japan's postwar quality movement: he championed quality circles, developed quality control courses for top managers and, as a member of the Deming Prize committee, built the audit system that decides which companies qualify [2].
The diagram became one of what Ishikawa later codified as the "7 Basic Quality Tools" — a set of visual analysis methods that non-statisticians could apply without specialized training [1]. It was widely adopted in manufacturing through the 1960s and 1970s, then spread to healthcare, software development, and organizational management. Today it appears regularly in Six Sigma, Lean, and KAIZEN programs.
The fishbone shape is not decorative. It forces you to categorize causes rather than list them as a flat inventory, and the visual structure makes it easier for teams to spot gaps — categories with too few branches, or branches that actually belong under a different heading.
The standard categories (6Ms)
In manufacturing and operations contexts, the six most common cause categories are known as the 6Ms [3]:
- Man (people): Human factors — skill gaps, fatigue, miscommunication, turnover, or insufficient training
- Machine (equipment): Tools, technology, software, or infrastructure that may be failing, misconfigured, or outdated
- Method (process): The procedures, workflows, and instructions in use — or the absence of standardized ones
- Матеріал: Raw inputs, data quality, supplies, or third-party content that affect the output
- Вимірювання: How results are tracked and reported — including calibration errors, missing metrics, or misleading KPIs
- Mother nature (environment): External conditions — physical workspace, seasonal demand, regulatory changes, or market pressures
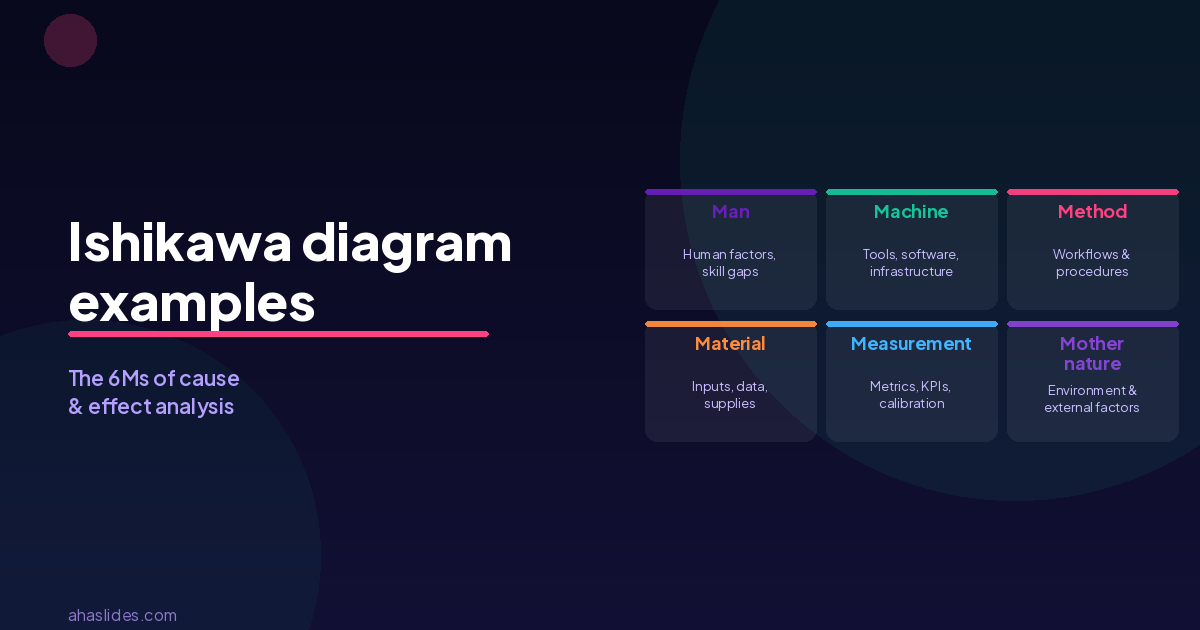
For service, HR, and knowledge-work contexts, the 6Ms are sometimes adapted. "Machine" becomes "technology," "material" becomes "information," and "Mother nature" is often replaced with "environment" or "culture." What matters is that every branch covers a meaningfully different domain so the team doesn't keep circling back to the same root causes under different labels.
A simpler alternative in non-manufacturing settings is the 4Ps: People, Process, Place, and Policy. It's less exhaustive than the 6Ms but faster to fill in for teams new to the method.
How to run a fishbone session
The diagram is most useful as a facilitated team activity, not a solo analysis. Here's a practical sequence:

1. Define the problem precisely. Write the problem statement at the head of the fish — the right end of the horizontal arrow. Be specific. "Low training completion rates" is a better problem statement than "training isn't working." Vague problem statements produce vague diagrams.
2. Choose your categories. Draw the main bones from the spine. Use the 6Ms as a starting point, then rename or swap any category that doesn't fit your context. For a people-heavy problem, you might add a "Policy" bone. For a technology problem, you might split "Machine" into "Hardware" and "Software."
3. Brainstorm causes per category. Ask for each bone: "What in this category could cause or contribute to the problem?" Write every suggestion as a sub-branch. Don't filter ideas during this stage — you want breadth before depth. A facilitator running this live can use a digital whiteboard or slides to capture input in real time.
4. Ask "why" at least once more. For each cause you've identified, push one level deeper. If "insufficient training" appears under "People," ask: why is training insufficient? Outdated content? No time allocated? No skill assessment before the course? These secondary causes are often where the real levers sit.
5. Identify high-priority causes. Once the diagram is full, ask the team to vote on which causes they believe are most significant or most addressable. Dot voting (each person gets three votes to place anywhere on the diagram) is a fast way to surface consensus. This is the step that converts the diagram from a map into an action list.
6. Validate before acting. The fishbone shows possible causes, not confirmed ones. Before assigning fixes, check whether the top-voted causes are supported by data — attendance records, completion stats, error logs, whatever is available. A well-run brainstorm can still produce confident-sounding hunches.
Ishikawa diagram examples
Example 1: Low completion rates in an L&D program
Проблема: Only 38% of enrolled employees completed the new compliance training by the deadline.
| Категорія | Потенційні причини |
|---|---|
| Люди | Managers didn't reinforce participation; employees didn't see relevance to their role |
| Процес | No reminder system; no escalation path for non-completions; completion tracked manually |
| Технологія | LMS had login issues on mobile; course didn't resume after interruption |
| зміст | Modules were 45 minutes each with no checkpoint saves; language was too technical |
| Вимірювання | Deadline communicated in one email three weeks before; no progress tracking visible to learners |
| Навколишнє середовище | Program launched during a high-pressure quarter; no protected learning time |
In this example, the immediate assumption might be "employees aren't motivated," but the diagram reveals that the system design and communication process contributed as much as attitude. Fixes in measurement and technology are often faster wins than trying to change behavior.
Example 2: High employee turnover in the first 90 days
Проблема: 22% of new hires resign within their first three months.
| Категорія | Потенційні причини |
|---|---|
| Люди | Hiring managers absent during first week; buddy or mentor not assigned |
| Процес | Onboarding schedule inconsistent across teams; no structured 30/60/90-day check-ins |
| Технологія | Access to systems delayed by 5–7 days; tools not pre-configured before start date |
| Інформація | Role expectations not clearly documented; team norms not communicated |
| Вимірювання | No early-warning indicators tracked; exit interview data not analyzed by cohort |
| Навколишнє середовище | Remote starters received no in-person touchpoints in first month |
This diagram makes it visible that the problem isn't just about hiring the wrong people — the process of integrating them has multiple failure points. The team can then prioritize: which of these causes explains the most departures? Data from exit interviews or 30-day pulse surveys can confirm the hypothesis.
Example 3: Poor ratings on post-training evaluations
Проблема: Average facilitator rating dropped from 4.1 to 3.3 out of 5 after switching to virtual delivery.
| Категорія | Потенційні причини |
|---|---|
| Люди | Facilitators trained for in-room delivery only; no virtual facilitation coaching provided |
| Процес | Session design unchanged from in-person format; no breakouts or interaction built in |
| Технологія | Platform unfamiliar to both facilitators and learners; technical issues in first 10 minutes |
| зміст | Slides not adapted for screen reading; too much text per slide |
| Вимірювання | Feedback survey sent 3 days after the session; recall of specifics was low |
| Навколишнє середовище | Participants joined from open-plan offices with background noise |
What looks like a facilitator performance problem turns out to be a transition management problem. The delivery medium changed, but the content, the tools, the training, and the support structure didn't change with it.
Example 4: Recurring errors in a business process
Проблема: Invoice processing errors have increased by 30% over the past two quarters.
| Категорія | Потенційні причини |
|---|---|
| Люди | High staff turnover in the processing team; new hires not fully trained |
| Процес | No standardized checklist; approval steps vary by team; manual data entry required |
| Технологія | Accounting software updated with no staff briefing; auto-fill feature not configured |
| Інформація | Vendor data formats inconsistent; purchase orders missing required fields |
| Вимірювання | Errors only caught at end-of-month reconciliation, not at point of entry |
| Навколишнє середовище | End-of-quarter volume spikes create time pressure |
This is a classic case where measurement timing amplifies the problem. Errors caught at point of entry are corrected immediately; errors caught at month-end take significantly longer to trace and fix. A single change to measurement (earlier detection) can reduce downstream cost more than retraining staff.
Поширені помилки, яких слід уникати
Listing symptoms instead of causes. "Poor communication" is a symptom. "No meeting structure for cross-team handoffs" is a cause. Push for specificity — if a cause can't be linked to a concrete behavior, process, or resource, it probably belongs one level deeper.
Stopping too early. A diagram with two or three causes per category is usually incomplete. Aim for at least five to eight sub-branches per bone before moving to prioritization. Thin diagrams tend to confirm what the team already believed.
Skipping the data step. The fishbone is a hypothesis generator, not a root cause finder. Teams that move straight from the diagram to a solution often fix the wrong thing with confidence. Any cause that gets voted to the top should be cross-checked against whatever data is available.
Running it solo. A diagram built by one person reflects one person's perspective. The real value comes from a cross-functional group — someone who runs the process, someone who measures it, someone who has experienced the problem firsthand, and ideally someone with no prior stake in the diagnosis.
Running a fishbone session with AhaSlides
The diagram works best as a facilitated group activity, but getting structured input from a team in real time is harder than it sounds. People hold back in plenary, the loudest voice sets the agenda, and it's easy to spend 30 minutes on one bone while others get skipped.
AhaSlides makes the input stage faster and more balanced. Before the diagramming session, you can run an open-ended question to collect possible causes anonymously — which removes status effects and gets quieter team members on the record. A word cloud or open text poll can surface the most frequently mentioned causes before the group has even opened the diagram template.
During the session, dot voting on which causes to prioritize takes about two minutes instead of 20. Participants vote on their own devices, results are visible instantly, and the facilitator can move straight to action planning without a lengthy debate about what the group "really thinks."
For L&D teams running root cause analysis as part of a training program — or HR teams working through a recurring problem with a management cohort — the combination of structured visual analysis and live audience input makes the session both more rigorous and more engaging than a whiteboard exercise.
Джерела
[1] ASQ (American Society for Quality). "What is a Fishbone Diagram? Ishikawa Cause & Effect Diagram." https://asq.org/quality-resources/fishbone
[2] ASQ (American Society for Quality). "Kaoru Ishikawa." Honorary members. https://asq.org/about-asq/honorary-members/ishikawa (archived copy, 29 Aug 2026). Covers his work on quality circles, executive quality control courses and the Deming Prize audit.
[3] Kaizen Institute. "Understanding the Ishikawa Diagram." https://kaizen.com/insights/ishikawa-diagram-root-cause-analysis/ — Explains the 6M categories and their application in continuous improvement programs.