ほとんどのプレゼンテーションは、他のどんな点よりも先に視覚的な問題で失敗します。スライドが詰め込みすぎだったり、グラフが3行目から読めなかったり、ストックフォトが伝えたい内容と全く関係なかったり。発表者が疑わしいことを言う前に、聴衆はプレゼンテーションへの信頼を失ってしまうのです。
もどかしいのは、これらの問題はどれも簡単に解決できるということだ。優れたビジュアルプレゼンテーションには、デザインの学位や高価なソフトウェアは必要ない。必要なのは、明確な原則を一貫して適用することだけだ。つまり、すべてのビジュアル要素は、スペースを埋めたり、労力を誇示したりするのではなく、メッセージをより明確にすることでその存在意義を示すべきだということだ。
このガイドでは、効果的なビジュアルフォーマット、優れたビジュアルプレゼンテーションと記憶に残らないプレゼンテーションを分けるテクニック、そしてそれらすべてを支えるデザイン原則について解説します。
視覚的なプレゼンテーションを効果的にする要素とは?
役に立つビジュアルと害になるビジュアルの違いは、たいてい意図にある。一つの重要なポイントを明確に示し、見逃すことのできないグラフは、その役割を果たしていると言える。一方、12ものデータ系列が詰め込まれ、注釈のないグラフは、凡例付きの単なるノイズに過ぎない。
他のあらゆる視覚フォーマットにも同じことが言えます。説明している状況に視聴者を導くような写真は、スライドに掲載する価値があります。ホワイトボードを指差している多様なチームのストックフォトは、何の価値もありません。「お客様は私たちを愛しています」という箇条書きよりも、真の感情が伝わる30秒の顧客動画の方が、はるかに効果的に伝わります。
意図的なデザインこそが基準だ。美しいデザインでも、複雑なデザインでもない。メッセージを伝え、視聴者の注意を尊重するデザインこそが基準なのだ。その他すべてはそこから派生する。
効果的な視覚補助教材の種類
コンテンツが異なれば、適切なビジュアルフォーマットも異なる。どのフォーマットを選ぶべきか、そしてその理由を理解することが、実務の大部分を占める。
インフォグラフィック および図
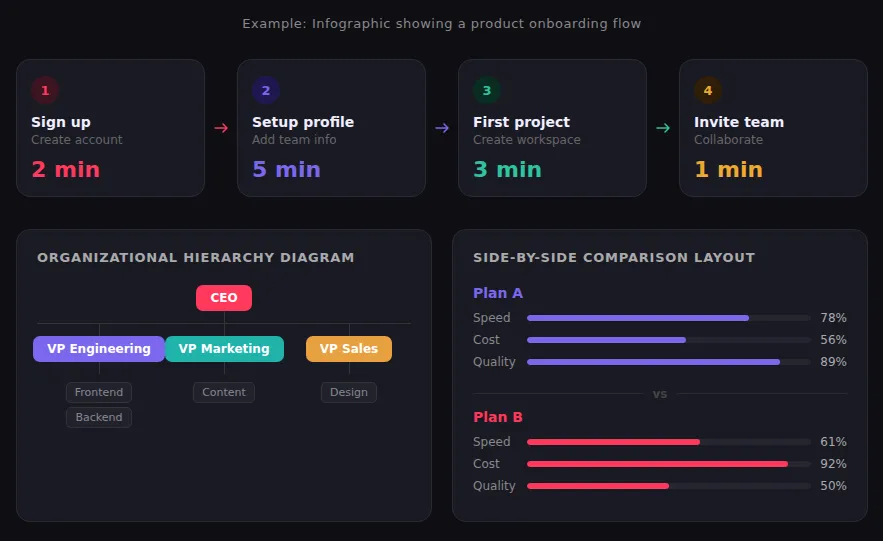
インフォグラフィックは、文章では分かりにくい構造を持つコンテンツ、例えば複数ステップのプロセス、選択肢の比較、階層構造、タイムライン、あるいは示す価値のあるパターンを持つデータセットなどにおいて、最も効果を発揮します。優れたインフォグラフィックは、アイコン、色、そして最小限のテキストを用いて、その構造を一目で理解できるようにしています。最もよくある間違いは、すべてを1つのグラフィックに詰め込もうとすることです。注意深く読む必要があるインフォグラフィックは、すでに失敗作と言えるでしょう。読者がじっくりと読み込む必要があるなら、シンプルにしましょう。
チャートとグラフ
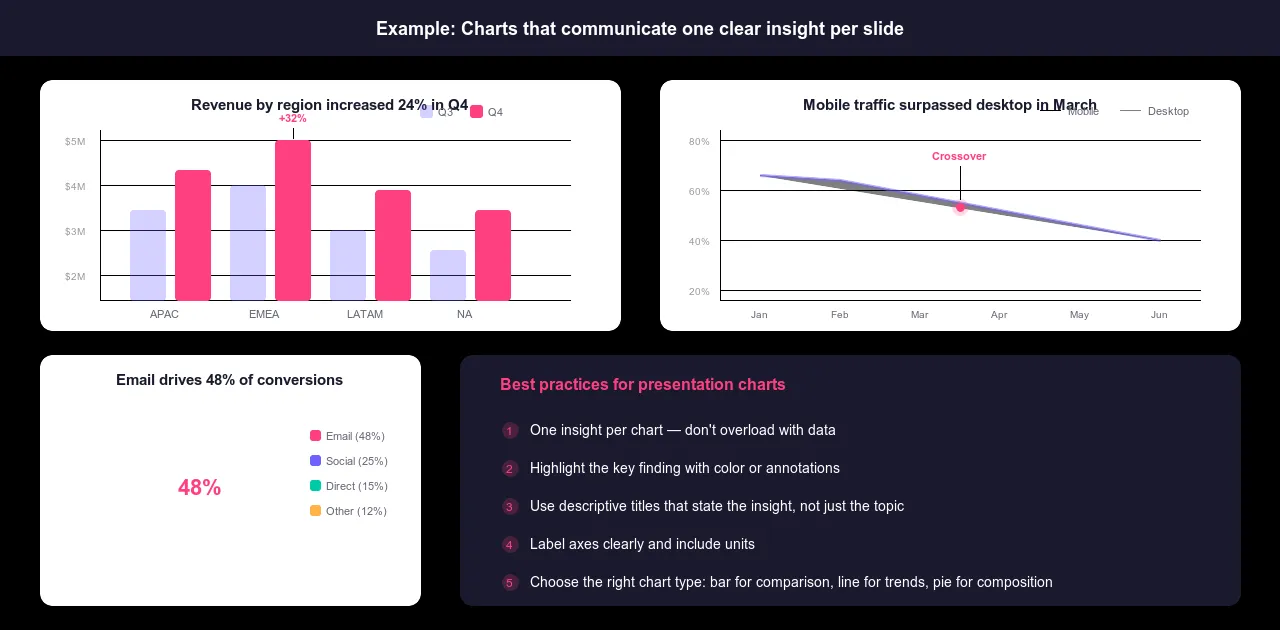
分析に何時間もかかったグラフは、その洞察を数秒で伝えるべきです。そのためには、グラフの種類が洞察と一致している必要があります。棒グラフは、カテゴリ間の値を比較するのに適しています。折れ線グラフは、時間の経過に伴う変化を示すのに適しています。円グラフは、全体のうち5つ以下の部分を示す場合にのみ、限定的に使用されます。散布図は、2つの変数間の関係を示すのに適しています。表は、視覚的なパターンよりも正確な数値が重要な場合に適しています。
最もよくある間違いは、表示内容に関係なく棒グラフをデフォルトにしてしまうことと、1つのグラフにあまりにも多くのデータ系列を詰め込みすぎることです。グラフ1つにつき1つの情報のみを表示しましょう。軸にはラベルを付け、単位も明記してください。色や注釈を使って、重要な発見に注目を集めましょう。文脈のないグラフは、凡例付きの単なるノイズです。
映像コンテンツ
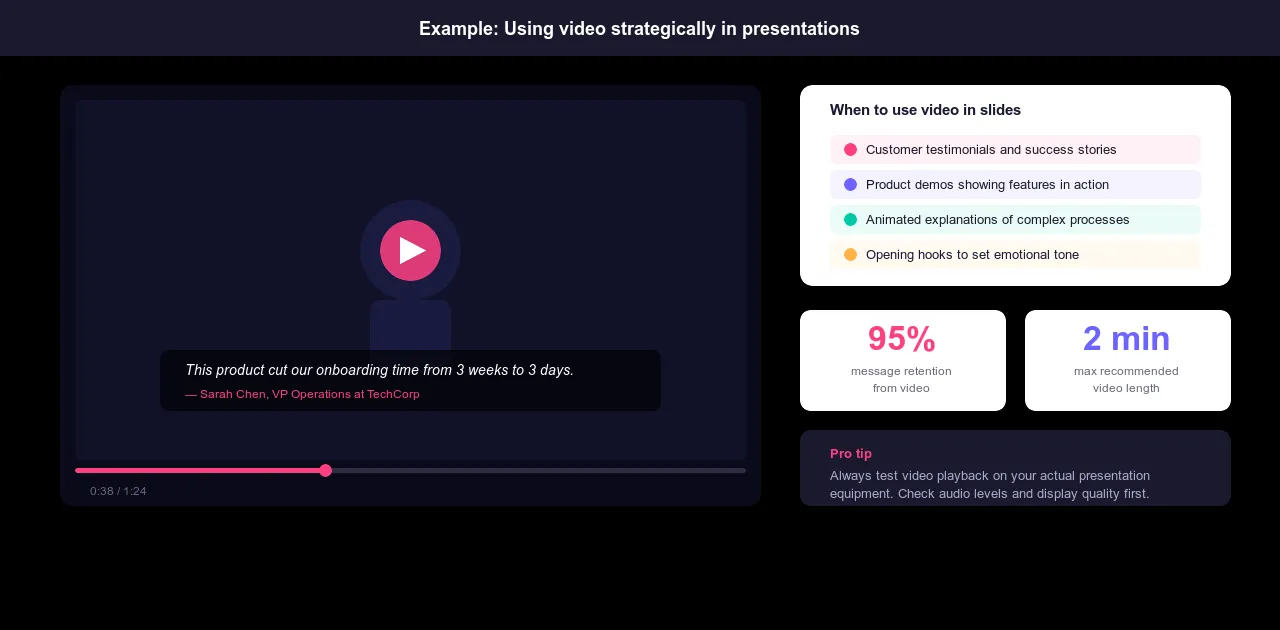
動画は、言葉で説明するよりも実際に見せる方がはるかに説得力がある場合に、その真価を発揮します。例えば、文章では効果が薄れてしまう顧客の声、スクリーンショットよりも実物の方が説得力のある製品デモンストレーション、そうでなければ確立できない信頼性を高める専門家インタビュー、静止画では伝えられない感情的な背景などです。
動画は2分以内に収めましょう。それ以上長くなると、聴衆はプレゼンテーションを見ることから動画を見ることに意識を切り替えなければならなくなり、セッションのリズムが崩れてしまいます。プレゼンテーションを行う前に、必ず実際のプレゼンテーション機器で再生テストを行ってください。再生できない動画や画質の悪い動画は、他の何よりも早くプレゼンテーションを台無しにしてしまいます。
写真と画像
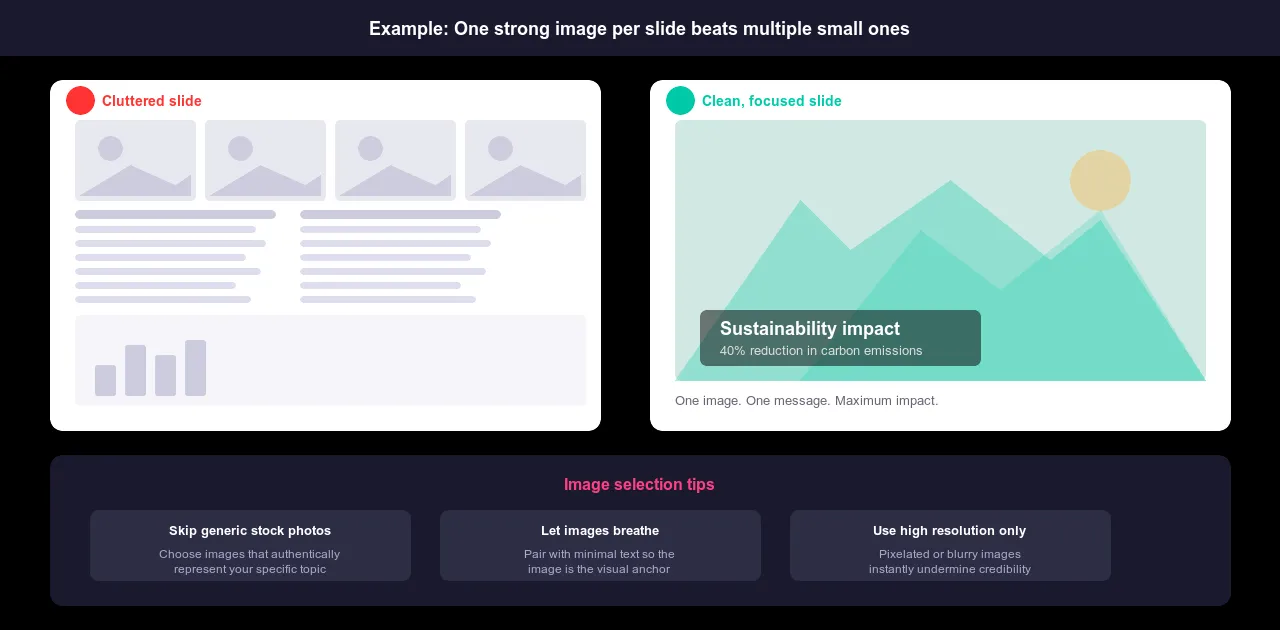
スライドごとに印象的な画像を1枚だけ使用し、テキストは最小限に抑える方が、小さな画像でごちゃごちゃしたスライドよりも効果的です。画像はスペースを他の要素と共有するのではなく、主役として活用しましょう。画像は視覚的な中心となるべきものであり、実際のコンテンツの傍らに添える装飾であってはなりません。
不適切な画像は、メッセージの説得力を著しく損ないます。ありきたりなストックフォトは、聴衆に何を見せるべきかを慎重に検討していないことを示唆します。技術系の聴衆にイノベーションについてプレゼンテーションを行う場合、会議室でビジネススーツを着た人々がハイタッチしている写真は逆効果です。テーマを的確に表現する画像を選びましょう。オリジナルの写真が入手可能な場合は、ストックフォトよりもほぼ間違いなく優れています。
インタラクティブな要素
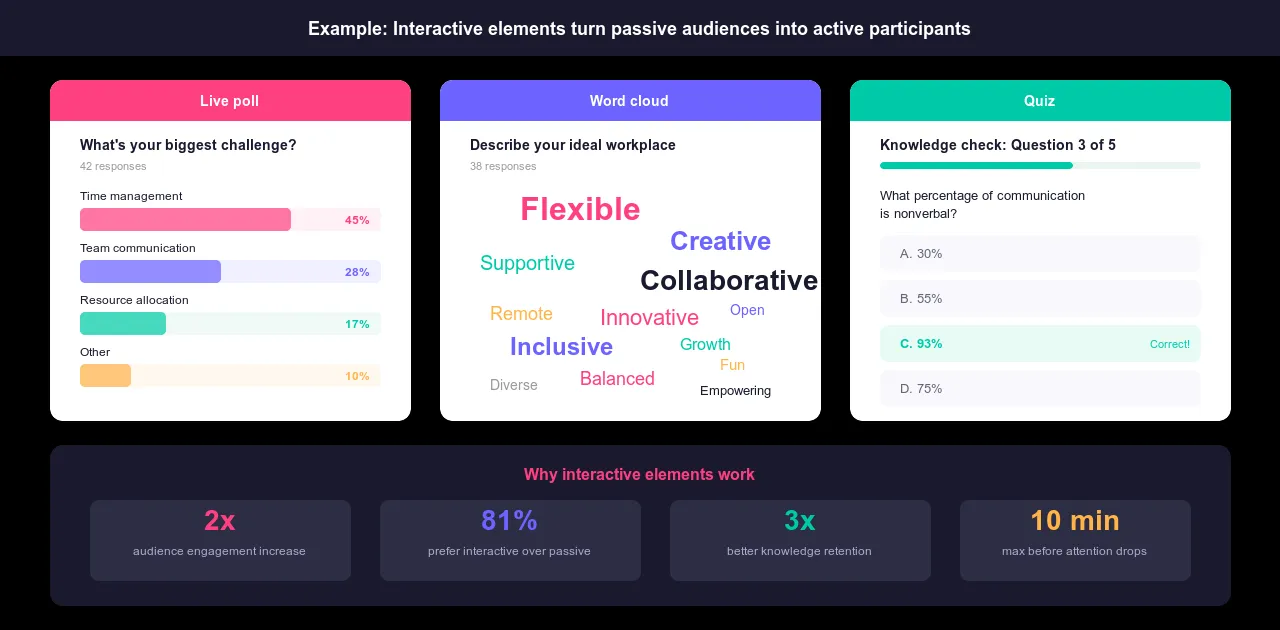
静止したスライドは一方向にしか流れません。 対話 要素はそれを逆転させる。つまり、聴衆に反応するきっかけを与え、受動的な聴取から能動的な参加へと力関係を変化させるのだ。
ライブ投票機能を使えば、聴衆の考えを変えようと試みる前に、彼らが既に何を信じているのかを把握できます。ワードクラウドは、リアルタイムで何が反響を呼んでいるかを示します。匿名Q&Aは、人々が声に出して質問しにくいことではなく、実際に疑問に思っていることを捉えます。クイズはプレゼンテーションの途中で理解度を確認するため、必要に応じてペースを落とすことができ、最後に混乱に気づくことを防ぎます。AhaSlidesはまさにこのような機能を備えています。
効果的なビジュアルプレゼンテーションを作成するための5つのテクニック
視覚表現の形式を理解することが基礎となります。これらのテクニックこそが、視覚表現を巧みに活用するプレゼンテーションと、単に効果的に活用するプレゼンテーションを分ける決定的な要素です。
1. 視聴者のニーズに焦点を当てる
同じテーマでも、異なる聴衆に対しては全く異なる視覚的アプローチが求められる。 データ分析 研究者にとってのテーマは、初めてビジネスを始めるオーナーにとってのテーマとは全く異なるものに見えるかもしれません。内容は重複するかもしれませんが、ビジュアルは重複すべきではありません。
スライドを1枚作成する前に、次の3つの質問を自問自答してください。この特定の聴衆は何を理解する必要があるのか?どの程度の詳細さが、彼らを圧倒するのではなく、彼らに役立つのか?どのようなビジュアルが、彼らを混乱させるのではなく、信頼できると感じさせるのか?
データサイエンティストは詳細なグラフと正確な分析手法を求めます。経営幹部はビジネスへの影響を示す要約的なビジュアルを求めます。新規事業主は、コンセプトを自身の状況に結びつける、親しみやすいものを求めます。ある層に好印象を与えるグラフが、別の層には受け入れられないこともあります。頭の中にある理想のコンテンツではなく、実際にその場にいる人々に合わせてデザインしましょう。
2. アニメーションとトランジションを意図的に使用する
アニメーションは評判が悪いが、それはほとんどのアニメーションが評判に値しないからだ。横から飛び込んでくるテキスト、回転しながら所定の位置に収まるスライド、跳ね返る箇条書き:これらは意味を付加することなく動きを加えるだけで、視聴者にあなたが間違ったことに時間を費やしたという印象を与える。
意図的なアニメーションは異なります。それは、視聴者が何を見るか、そしていつ見るかをコントロールします。分析を進めていく中で、チャートの要素を一つずつ表示することで、全体像が見える前に視聴者が各ポイントに集中できるようにします。プロセス図は、すべての段階を同時に表示するのではなく、段階的に構築します。複雑なビジュアルの特定の部分に注目を集めてから、表示を拡大します。主要なセクション間の遷移は、唐突ではなく、意図的であると感じられる方法で示します。
テストは簡単だ。アニメーションを削除しても何も変わらないなら、削除すればいい。アニメーションは、コンテンツをより分かりやすくするか、テンポをより意図的にするものであるべきだ。それ以外の理由でアニメーションを使うべきではない。
3. 意味のあるスライドタイトルを書く
ブリッジ スライドタイトル 内容が曖昧だったり、全く記載されていなかったりします。「概要」「分析」「第3四半期決算」といったタイトルでは、これから何を見せられるのか全く分かりません。スライドのタイトルは、タイトルだけで内容が理解できるほど具体的であるべきです。
「データ」の代わりに「モバイルトラフィックは前年比35%増加しました」を使用してください。「プロセス」の代わりに「実装までの3つのステップ」を使用してください。「調査結果」の代わりに「北東部を除くすべての地域で顧客満足度が低下しました」を使用してください。洞察はタイトルに示されています。スライドはそれを裏付けています。
タイトルはナビゲーションの役割も果たします。読者が一時的に話の流れを見失った場合でも、具体的なタイトルがあれば、同じ内容を繰り返してもらうことなく、再び目的の箇所にたどり着くことができます。タイトルは本文とは視覚的に区別できるように、大きく太字にし、最初に目に入るようにフォーマットを整えましょう。
4. 小道具や創造的な視覚補助具を活用する
スライドは標準的なツールですが、必ずしも最良のツールとは限りません。手に取って操作できる実物のプレゼンテーションは、スクリーンショットでは決して再現できない具体性を生み出します。抽象的な概念を具体的に示す小道具は、聴衆にとって理解の拠り所となります。斬新なビジュアルフォーマット、アイソメトリック図、手描きの図、縦型レイアウトなどは、前夜に慌てて作成したようなありきたりな企業プレゼンテーションではないことを示唆します。
小道具やクリエイティブなビジュアルは、単に注目を集めるだけでなく、関連性がある場合に効果を発揮します。実際に製品を手に取って操作する製品デモは、製品の説明を5枚のスライドで行うよりも説得力があります。個人的なストーリーを伝える個人的な写真は、同じストーリーを伝えるストック画像よりも重みがあります。クリエイティブな選択は、メッセージに取って代わるものではなく、メッセージを支えるものでなければなりません。
5. ビジュアルを使ってリハーサルを行い、フィードバックを集める
ノートパソコン上で見栄えの良いプレゼンテーションでも、実際の会場では見栄えが良くない場合があります。発表前に、実際に使用する機器で全てをテストしてください。動画はバッファリングなしで再生されますか?テキストは最後列からでもはっきりと読めますか?会場の照明の下で色は適切に見えますか?これらは、発表の途中でではなく、リハーサルで確認しておきたい点です。
本番前にテスト聴衆にプレゼンテーションを行いましょう。「どう思いましたか?」といった漠然とした質問ではなく、具体的な質問を投げかけましょう。グラフは分かりやすかったですか?視覚的に分かりにくい点や、気が散るような点はありましたか?動画は何か付加価値を与えてくれましたか、それとも不必要に時間を浪費してしまいましたか?曖昧なフィードバックでは、改善点も曖昧になってしまいます。具体的に何がうまくいかなかったのかを尋ねれば、実際に修正できる情報が得られます。
伝えたいメッセージに合わないビジュアルは削除しましょう。分かりにくいグラフはより分かりやすいものに置き換えましょう。効果のない動画はカットしましょう。残すビジュアルは、作成に時間をかけたからではなく、プレゼンテーションをより効果的にするからこそ残すべきです。
視覚的インパクトのためのデザイン原則
優れたビジュアルデザインは装飾ではありません。それは、最初のスライドから最後のスライドまで、コンテンツを読みやすく、分かりやすく、一貫性のあるものにするためのシステムです。これらの6つの原則は、形式、トピック、対象者に関わらず、あらゆるビジュアルプレゼンテーションに適用されます。
コントラスト 階層構造を確立するには、これが重要です。スライド上のすべてが同じように見えると、何も際立ちません。グラフでは、重要な数値を太字にしましょう。議論の根拠となるデータポイントは色を使って強調表示しましょう。各スライドで最も重要な要素を周囲の要素と視覚的に区別することで、聴衆は指示されなくてもどこを見ればよいかが分かります。
アラインメント 意図的なデザインと偶然のデザインを分けるのは、まさにこの点です。一定の余白に揃えられたテキスト、計算された位置に配置されたグラフ、互いに整列した要素。こうした選択は、スライドについて誰かが慎重に考えたことを示しています。これらの要素が欠けている場合は、その逆です。要素の配置がずれていると、見た目がプロらしくないだけでなく、長時間のプレゼンテーションを通して、認知的な摩擦が蓄積されていきます。
繰り返し プレゼンテーションを、異なるソースから寄せ集めたスライドの集合体ではなく、一つのまとまったものに感じさせるのは、統一感です。全体を通して同じ配色を使用し、フォントも一貫して選び、レイアウトパターンも繰り返します。繰り返しによって、聴衆は最初の数枚のスライドで視覚的な言語を習得し、その後はプレゼンテーション全体をスムーズに読み進めることができます。意図的にそうしない限り、この統一感を崩してはいけません。
近接 関係性を明確に示しましょう。関連する要素はまとめて配置すべきです。図表とその説明文は、関係性が一目でわかるように十分近い位置に配置するべきです。論理的に関連する箇条書きはグループ化しましょう。関連する要素がスライド全体に散らばっていると、聴衆はそれらを関連付けるために余分な思考を要します。その思考の負担は、あなたの話を聞く時間を奪うことになります。
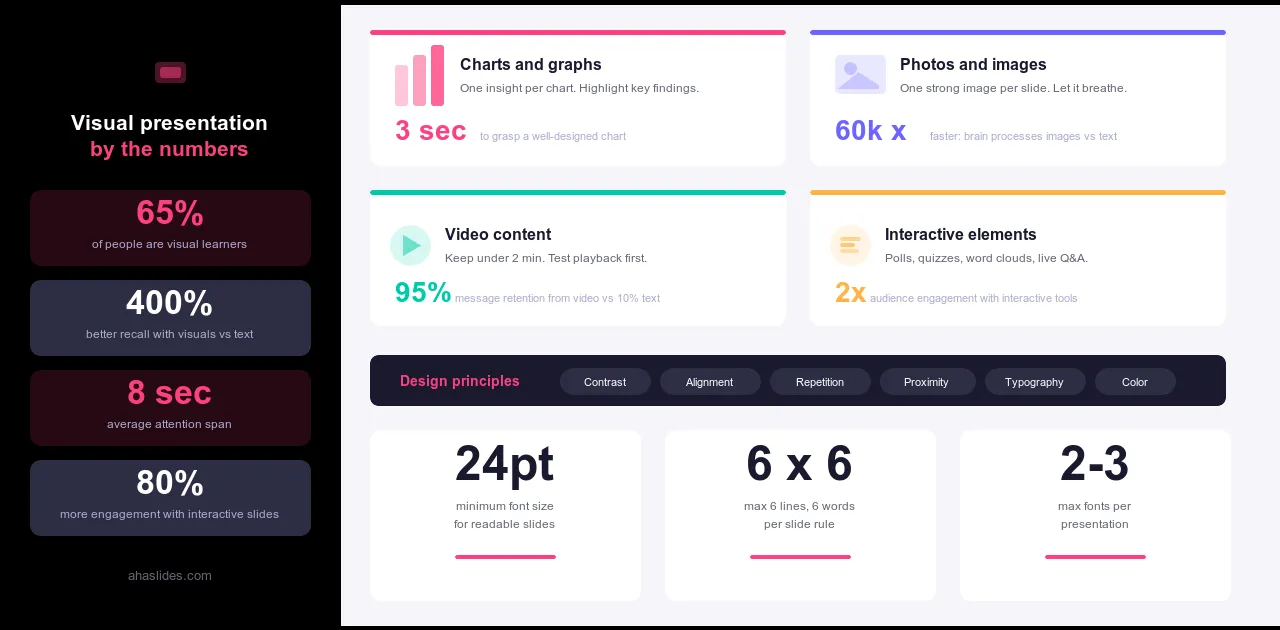
タイポグラフィ 視覚的なプレゼンテーションにおいても、フォントサイズは重要です。部屋の後ろからでも読めるように、十分な大きさのフォントを使用しましょう。最低でも20ポイント、可能であれば24ポイント以上が望ましいです。本文にすべて大文字を使うのは避けましょう。大文字と小文字が混在しているよりも読みにくくなります。プレゼンテーションごとに使用するフォントスタイルは2種類までに制限しましょう。それ以上になると、タイポグラフィがコンテンツをサポートするどころか、コンテンツと競合するようになります。
色圏 色は、雰囲気を伝えると同時に、人々の注意を誘導するという2つの役割を同時に果たします。一貫した配色を全体に適用することで、プロフェッショナルで意図的な印象を与えます。特定のデータポイントを強調したり、重要な発見を際立たせるために色を使用すると、見る人の視線を重要な点へと導きます。しかし、多くの場所に多くの色を使用すると、注意が分散してしまい、集中力を高める効果は得られません。配色を選び、それを一貫して適用し、アクセントカラーは控えめに使用することで、登場した際に意味を持つようにしましょう。
視覚的なプレゼンテーションで避けるべきこと
視覚的なプレゼンテーションにおける間違いは、大きく分けて2つのカテゴリーに分類されます。一つは、本来必要のない要素を追加してしまうこと、もう一つは、本来必要な要素を省略してしまうことです。以下に、注意すべき点をご紹介します。
追加要素としては、内容がどれほど優れていてもスライドを古臭く見せてしまうクリップアートや低解像度の画像、意味を付加することなく動きを加えるだけの装飾的なアニメーション、注目を集めようと競い合う2種類以上のフォントスタイル、明るい部屋ではテキストが読みにくくなるコントラスト不足の配色、グラフ、画像、テキスト、アイコンなど、視覚要素を一度に詰め込みすぎてどれも中途半端なスライドなどが挙げられます。
省略された例としては、軸や単位が明記されていないグラフがあり、聴衆が何を見ているのか推測するしかないもの。タイトルがない、あるいはタイトルが曖昧すぎて何の手がかりにもならないスライド。伝えたい内容と明確な関連性のない画像。計画されていたインタラクティブな要素が組み込まれておらず、聴衆がセッション全体を通して受動的な状態になってしまうもの。
どちらの場合も根本的な原則は同じです。すべての要素は、メッセージを伝えるために存在しているべきです。スライドに画像が含まれている理由を1文で説明できないのであれば、おそらくその画像は含めるべきではないでしょう。
AhaSlidesでさらに進化
優れたビジュアルプレゼンテーションとそうでないものを分ける重要な要素の一つは、聴衆がただ見ているか、それとも参加しているかという点です。どんなにデザインが優れていても、静止画は一方通行です。聴衆はそれを受け取るだけで、反応を示しません。
インタラクティブな要素を取り入れることで、状況は一変します。プレゼンテーションの途中で実施するリアルタイムのアンケートは、聴衆に考えてほしいことを事前に伝える前に、彼らが実際に何を考えているかを明らかにします。ワードクラウドは、どのアイデアがリアルタイムで反響を呼んでいるかを示します。匿名での質疑応答は、人々が抱えているものの、声に出しては聞けない疑問を捉えます。これらはプレゼンテーションの妨げになるものではありません。視覚的なコンテンツと聴衆の反応が交わる瞬間なのです。
AhaSlidesを使えば、こうした瞬間を簡単に作り出すことができます。アンケート、クイズ、ワードクラウド、質疑応答などは、プレゼンテーションの流れに自然に溶け込むように配置できます。その結果、視覚的な要素が効果的に機能し、聴衆が最後まで集中して参加できるセッションが実現します。
包み込む
人々の記憶に残るプレゼンテーションは、最も印象的なグラフィックを使ったものではありません。それは、視覚的な要素すべてが明確な目的を持ち、聴衆が内容を理解するために苦労する必要がなく、デザインが邪魔にならず、コンテンツが本来の役割を果たすように配慮されたプレゼンテーションなのです。
それは達成可能な基準です。デザインの専門知識や高価なツールは必要ありません。このガイドで目指してきたのと同じ規律、つまり「意図」が必要です。それぞれのビジュアルがなぜそこにあるのかを理解しましょう。それが視聴者に何を求めているのかを理解しましょう。これらの質問に答えられないものはすべて取り除きましょう。
あとは実行するだけだ。そして、実行は繰り返すほど簡単になる。