
Sie haben die Umfrage verschickt. Vierzig Personen haben geantwortet. Und nun starren Sie auf eine Tabelle mit Zahlen, die Ihnen kaum etwas sagen. Meistens liegt das Problem nicht am Thema, sondern an den gewählten Fragetypen. Das richtige Format kann aus demselben Thema aussagekräftige und verwertbare Daten gewinnen. Das falsche Format hingegen lässt sie im Dunkeln verschwinden. Dieser Leitfaden stellt die acht gängigsten Fragetypen vor und gibt Beispiele sowie Tipps, wann welcher Typ am besten geeignet ist.
Für jeden Fragetyp finden Sie Informationen zu seinen Anwendungsbereichen, seinen Stärken und worauf Sie achten sollten. Dies umfasst Schulungsevaluationen, Mitarbeiterfeedback, Veranstaltungsumfragen und Kundenforschung. Die Fragetypen reichen von geschlossenen Formaten mit vorgegebenen Antwortmöglichkeiten bis hin zu offenen Fragen, die Freitextantworten ermöglichen, und eignen sich für alles – von einer kurzen Stimmungsabfrage bis hin zu einem umfassenden Fragebogen.
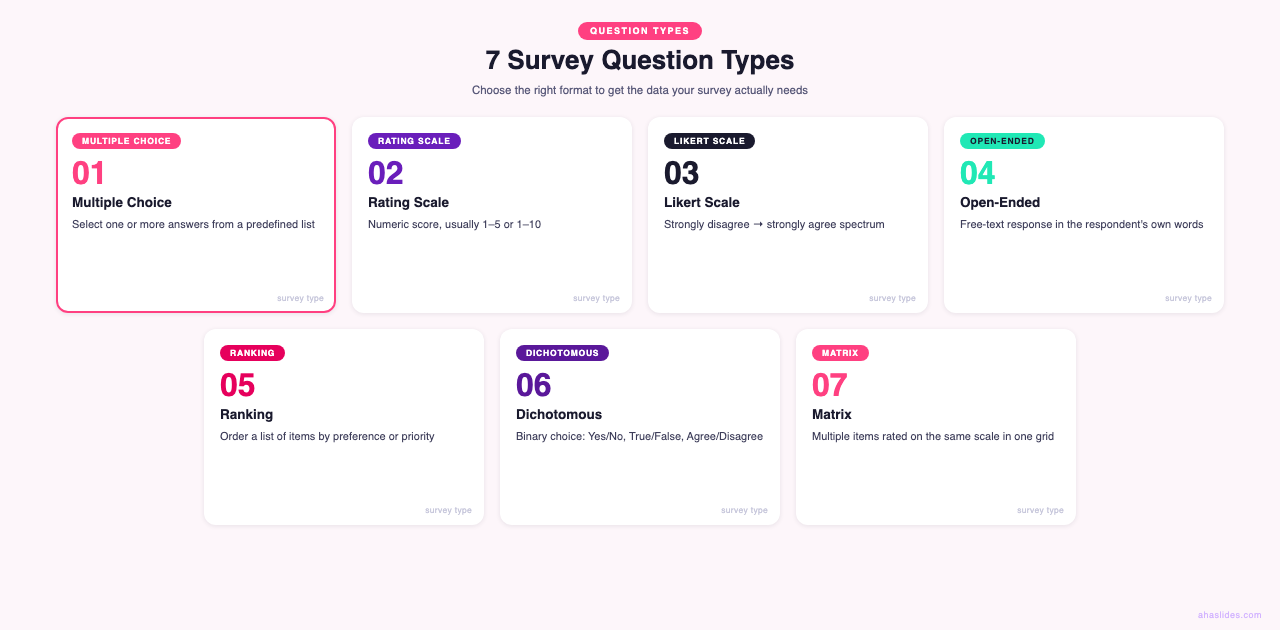
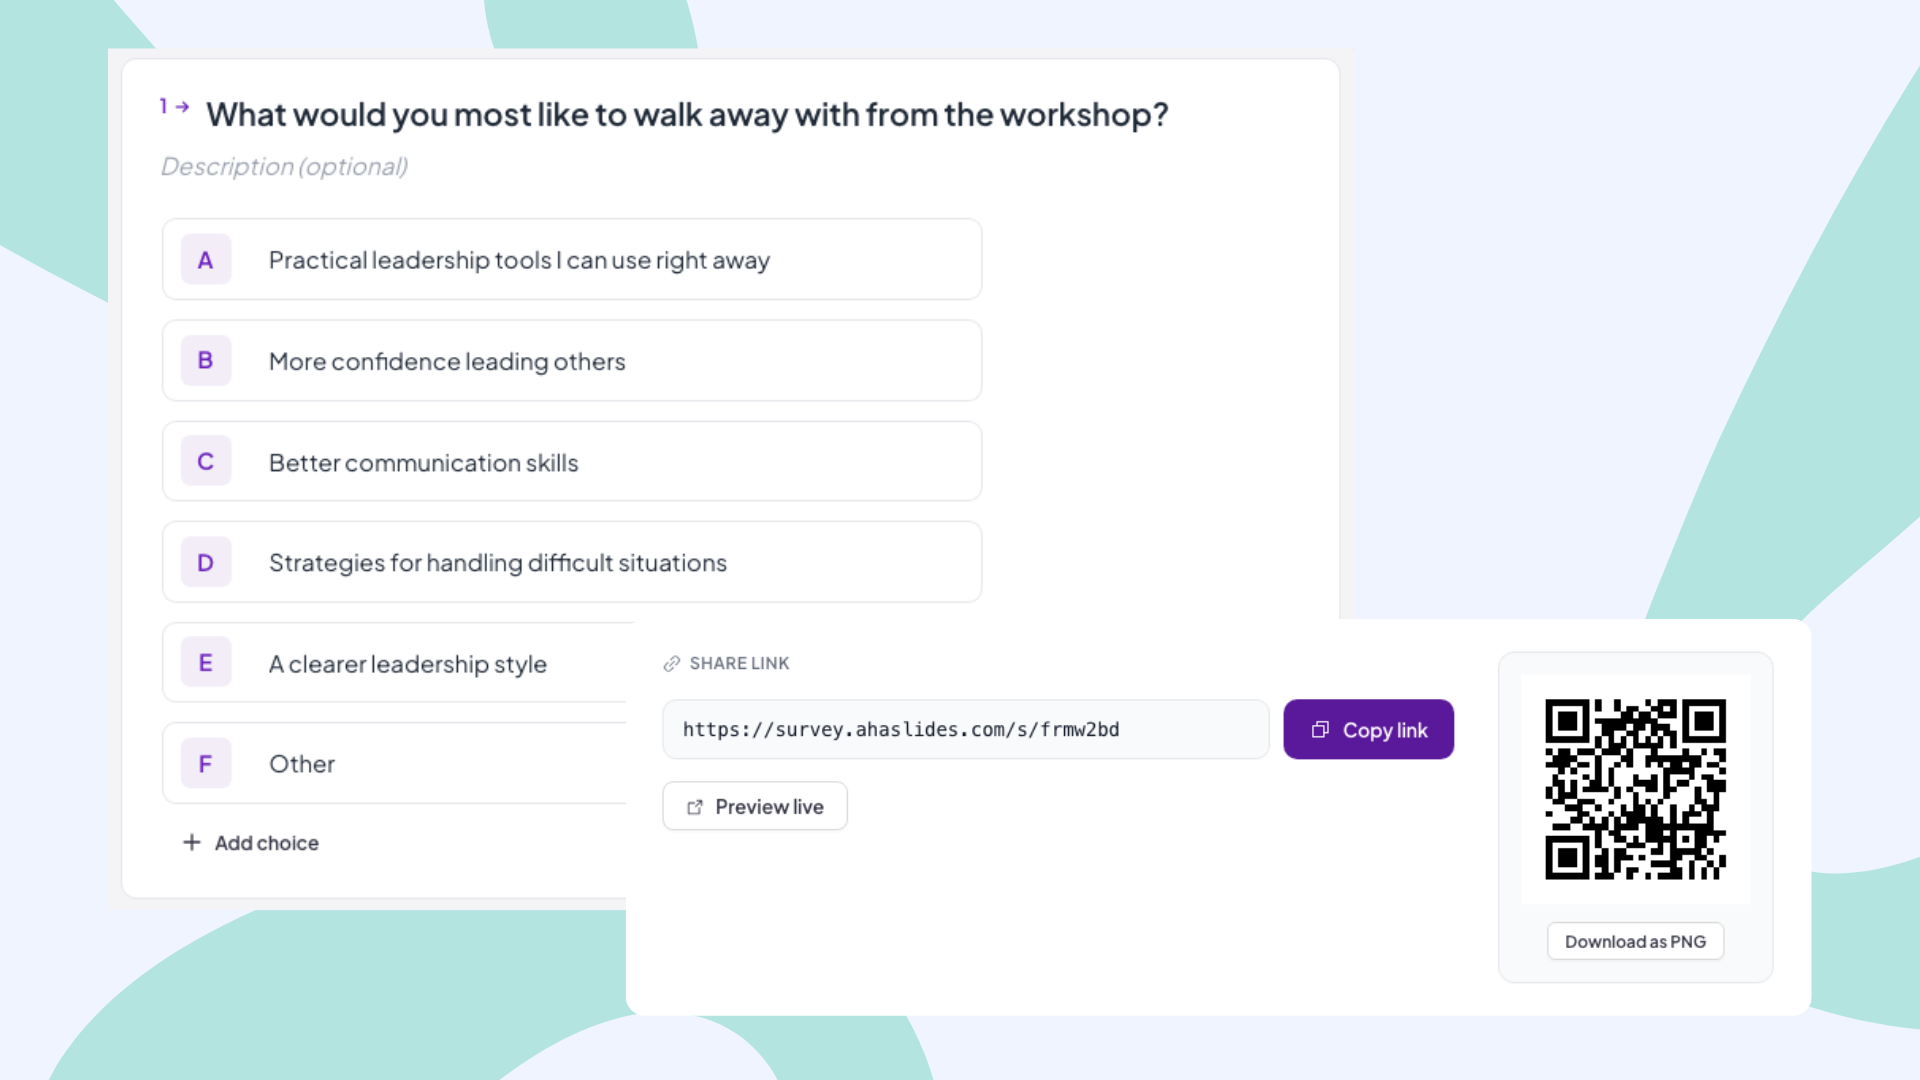
1. Multiple Choice
Multiple-Choice-Fragen bieten eine vordefinierte Auswahl an Antwortmöglichkeiten. Bei Einfachauswahlfragen muss nur eine Antwort ausgewählt werden; bei Mehrfachauswahlfragen können die Befragten mehrere Antworten auswählen.
Am besten geeignet für demografische Daten, Verhaltenssegmentierung und Präferenzfragen, bei denen die Optionen bekannt sind. Beispiele:
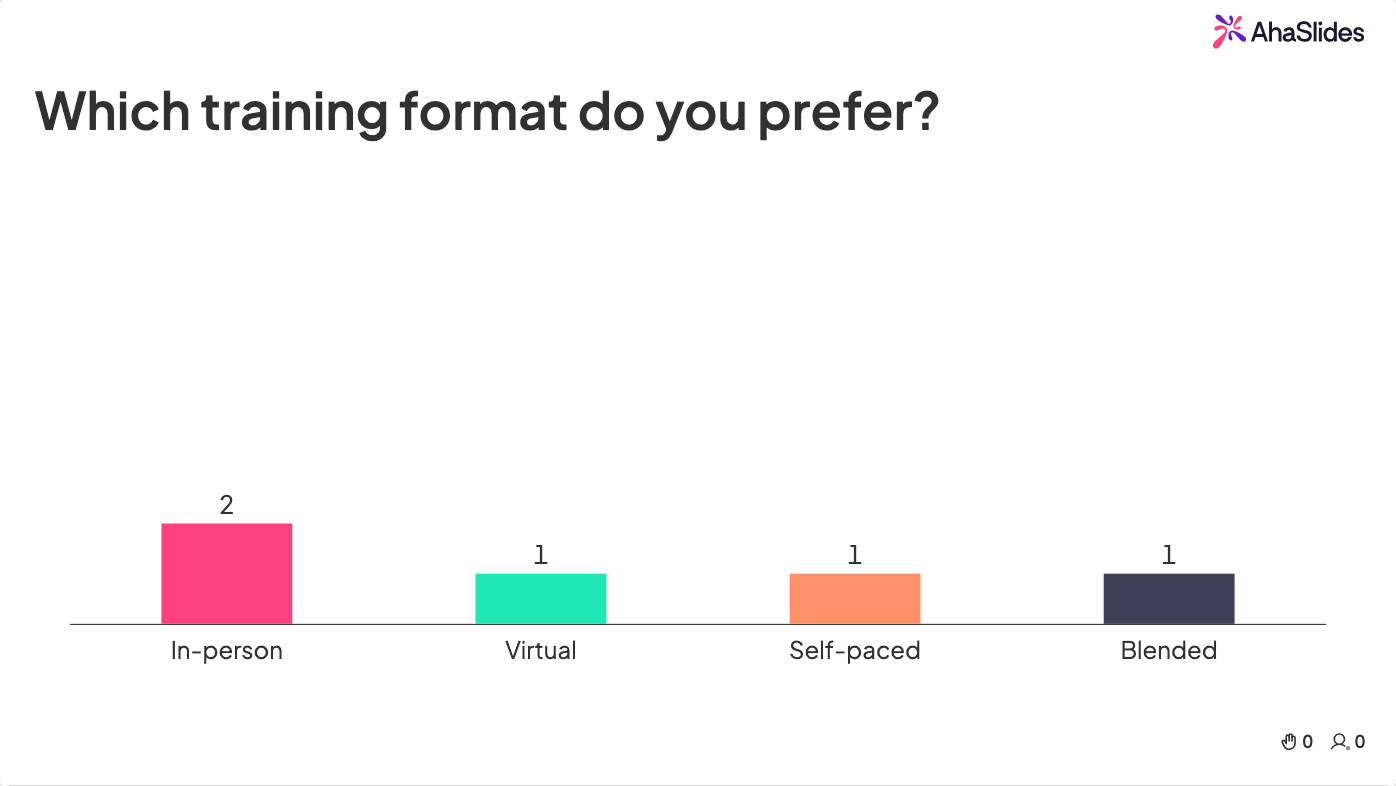
- "Welches Schulungsformat bevorzugen Sie? (Präsenzschulung / Virtuell / Selbstgesteuert / Blended Learning)"
- „Welche der folgenden Themen möchten Sie in zukünftigen Sitzungen behandelt sehen? (Mehrfachauswahl möglich)“
Achten Sie auf unvollständige Antwortmöglichkeiten, die Befragte zu einer falschen Antwort verleiten. Fügen Sie immer die Option „Sonstiges (bitte angeben)“ hinzu, wenn Sie nicht sicher sind, alle Möglichkeiten abgedeckt zu haben. Ordnen Sie die Antwortmöglichkeiten zufällig an, um Verzerrungen durch die Position zu vermeiden, bei denen Befragte immer die erste oder letzte Antwort wählen.
2. Bewertungsskalen
Bewertungsskalen fordern die Befragten auf, etwas auf einer numerischen Skala zu bewerten, typischerweise von 1 bis 5, 1 bis 7 oder 1 bis 10. Sie quantifizieren Zufriedenheit, Qualität und Wahrscheinlichkeit auf eine Weise, die sich leicht vergleichen und im Laufe der Zeit verfolgen lässt.
Am besten geeignet zur Messung von Zufriedenheit, Leistung und Erfahrung. Die gebräuchlichste professionelle Anwendung ist der Net Promoter Score (NPS), der 2003 von Fred Reichheld in einem Artikel der Harvard Business Review eingeführt wurde [1]. Der NPS verwendet eine Skala von 0 bis 10, um die Weiterempfehlungswahrscheinlichkeit zu messen. Beispiele:
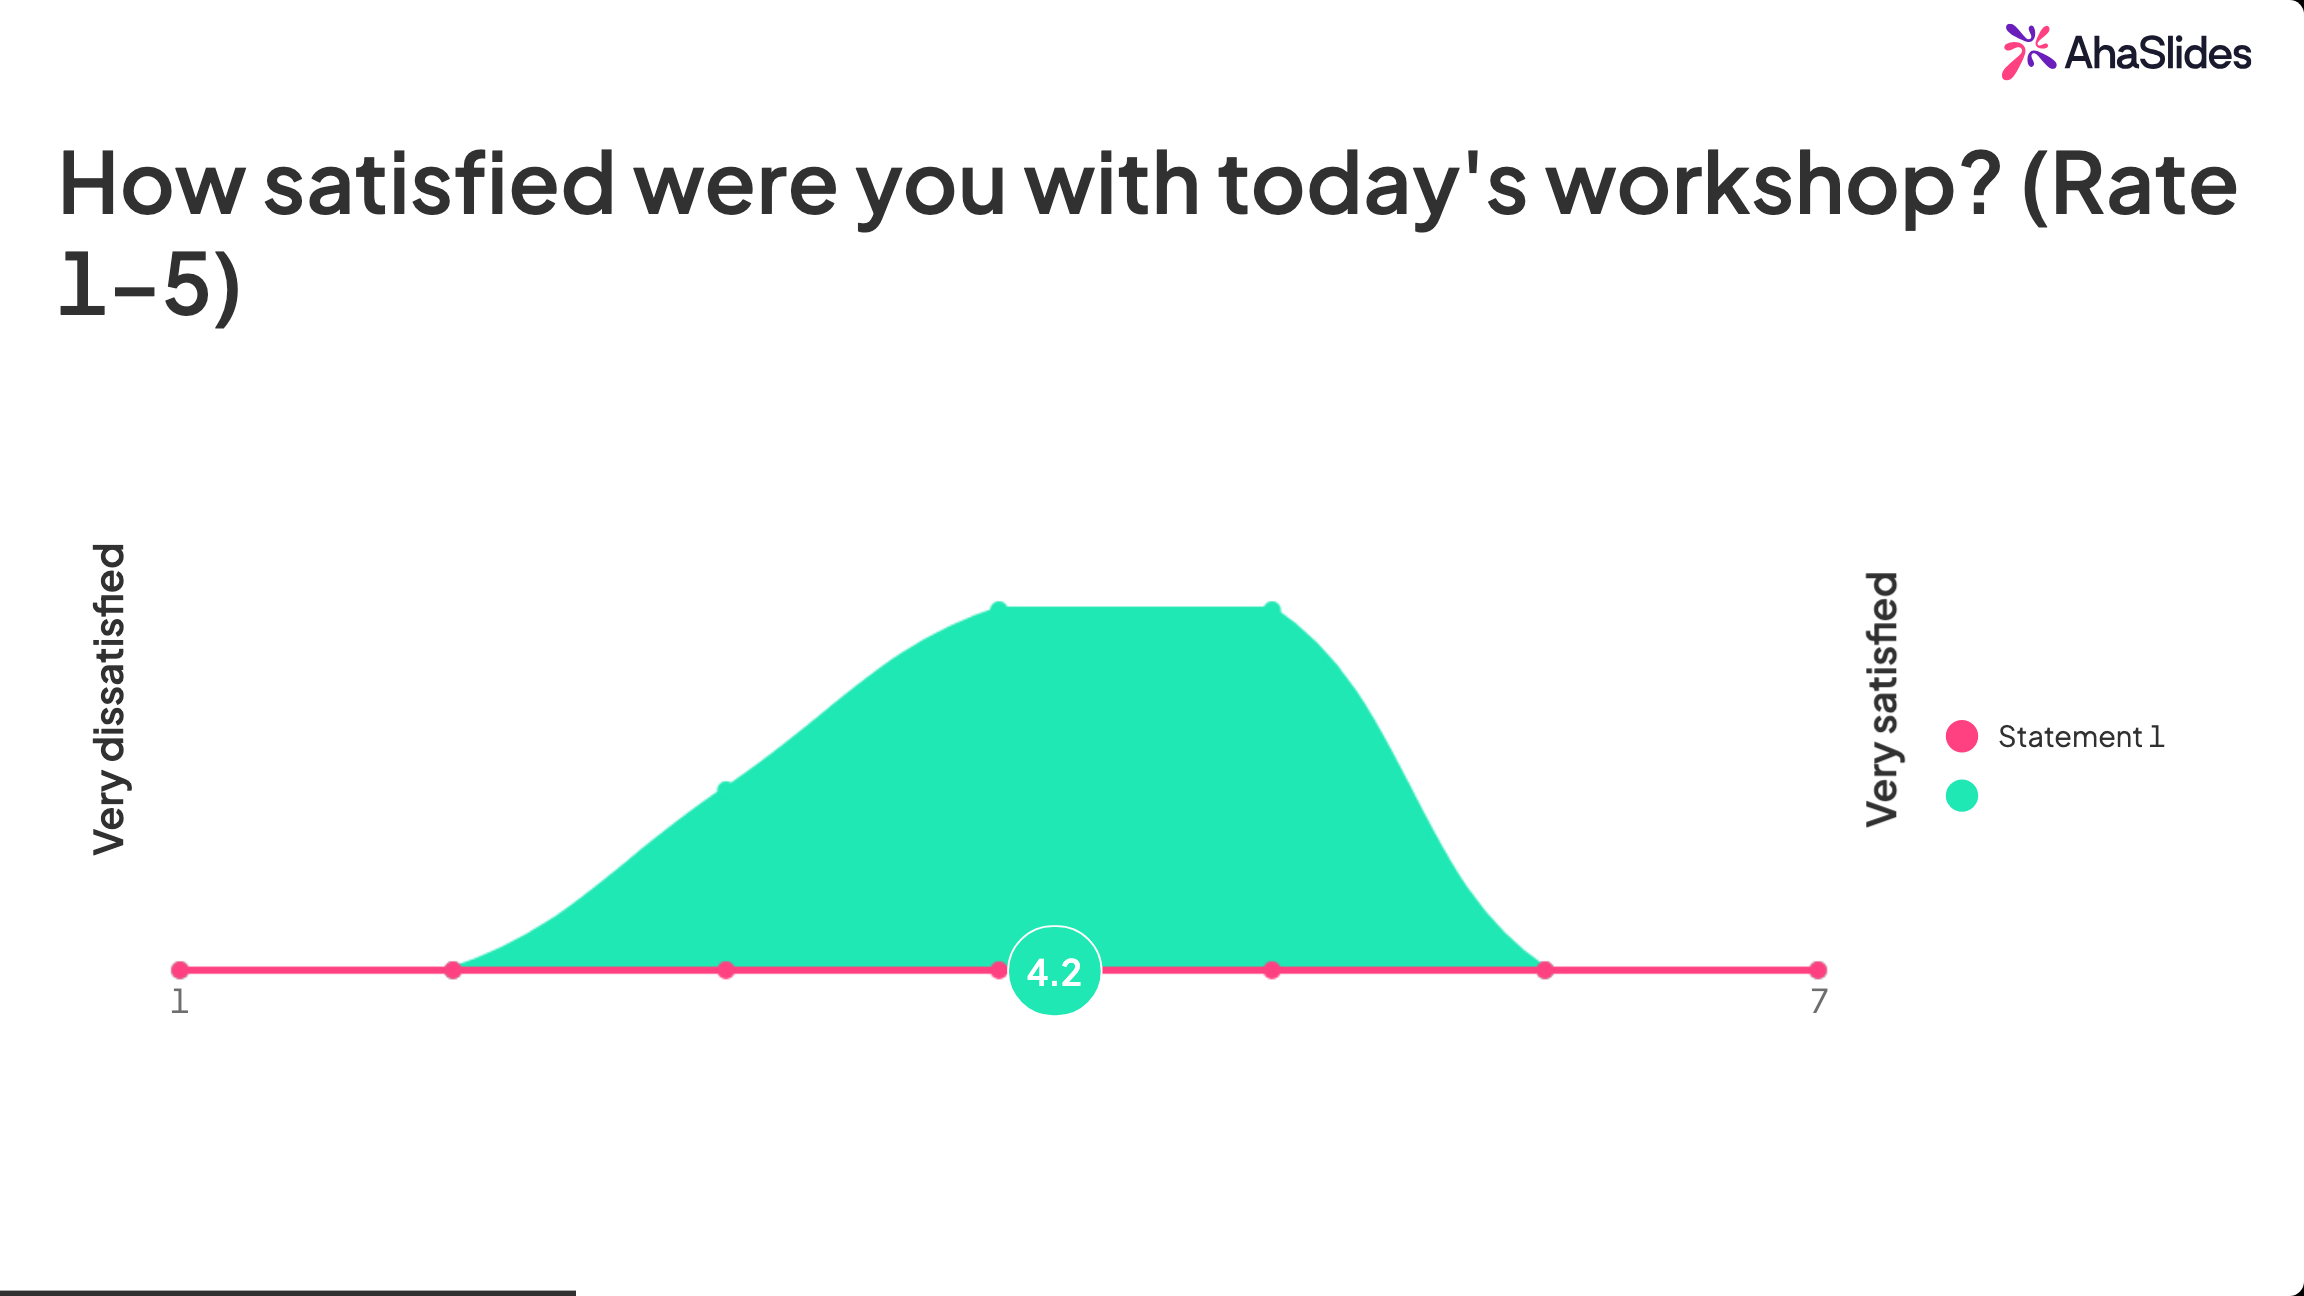
- "Wie zufrieden waren Sie mit dem heutigen Workshop? (1–5)"
- "Wie wahrscheinlich ist es, dass Sie diese Schulung einem Kollegen empfehlen würden? (0–10)"
Verwenden Sie für Ihre Endpunkte stets klare Bezeichnungen: „1 = Sehr unzufrieden, 5 = Sehr zufrieden“. Unbeschriftete Skalen führen dazu, dass Befragte die Zahlen unterschiedlich interpretieren. Beim NPS werden die Befragten standardmäßig in Befürworter (9–10), Passive (7–8) und Kritiker (0–6) eingeteilt [1].
3. Likert-Skalen
Likert-Skalen präsentieren Aussagen, die die Befragten auf einem Kontinuum der Zustimmung bewerten, von „Stimme überhaupt nicht zu“ bis „Stimme voll und ganz zu“. Sie sind technisch gesehen eine Art Bewertungsskala, aber in professionellen Umfragen so verbreitet, dass sie gesondert behandelt werden.
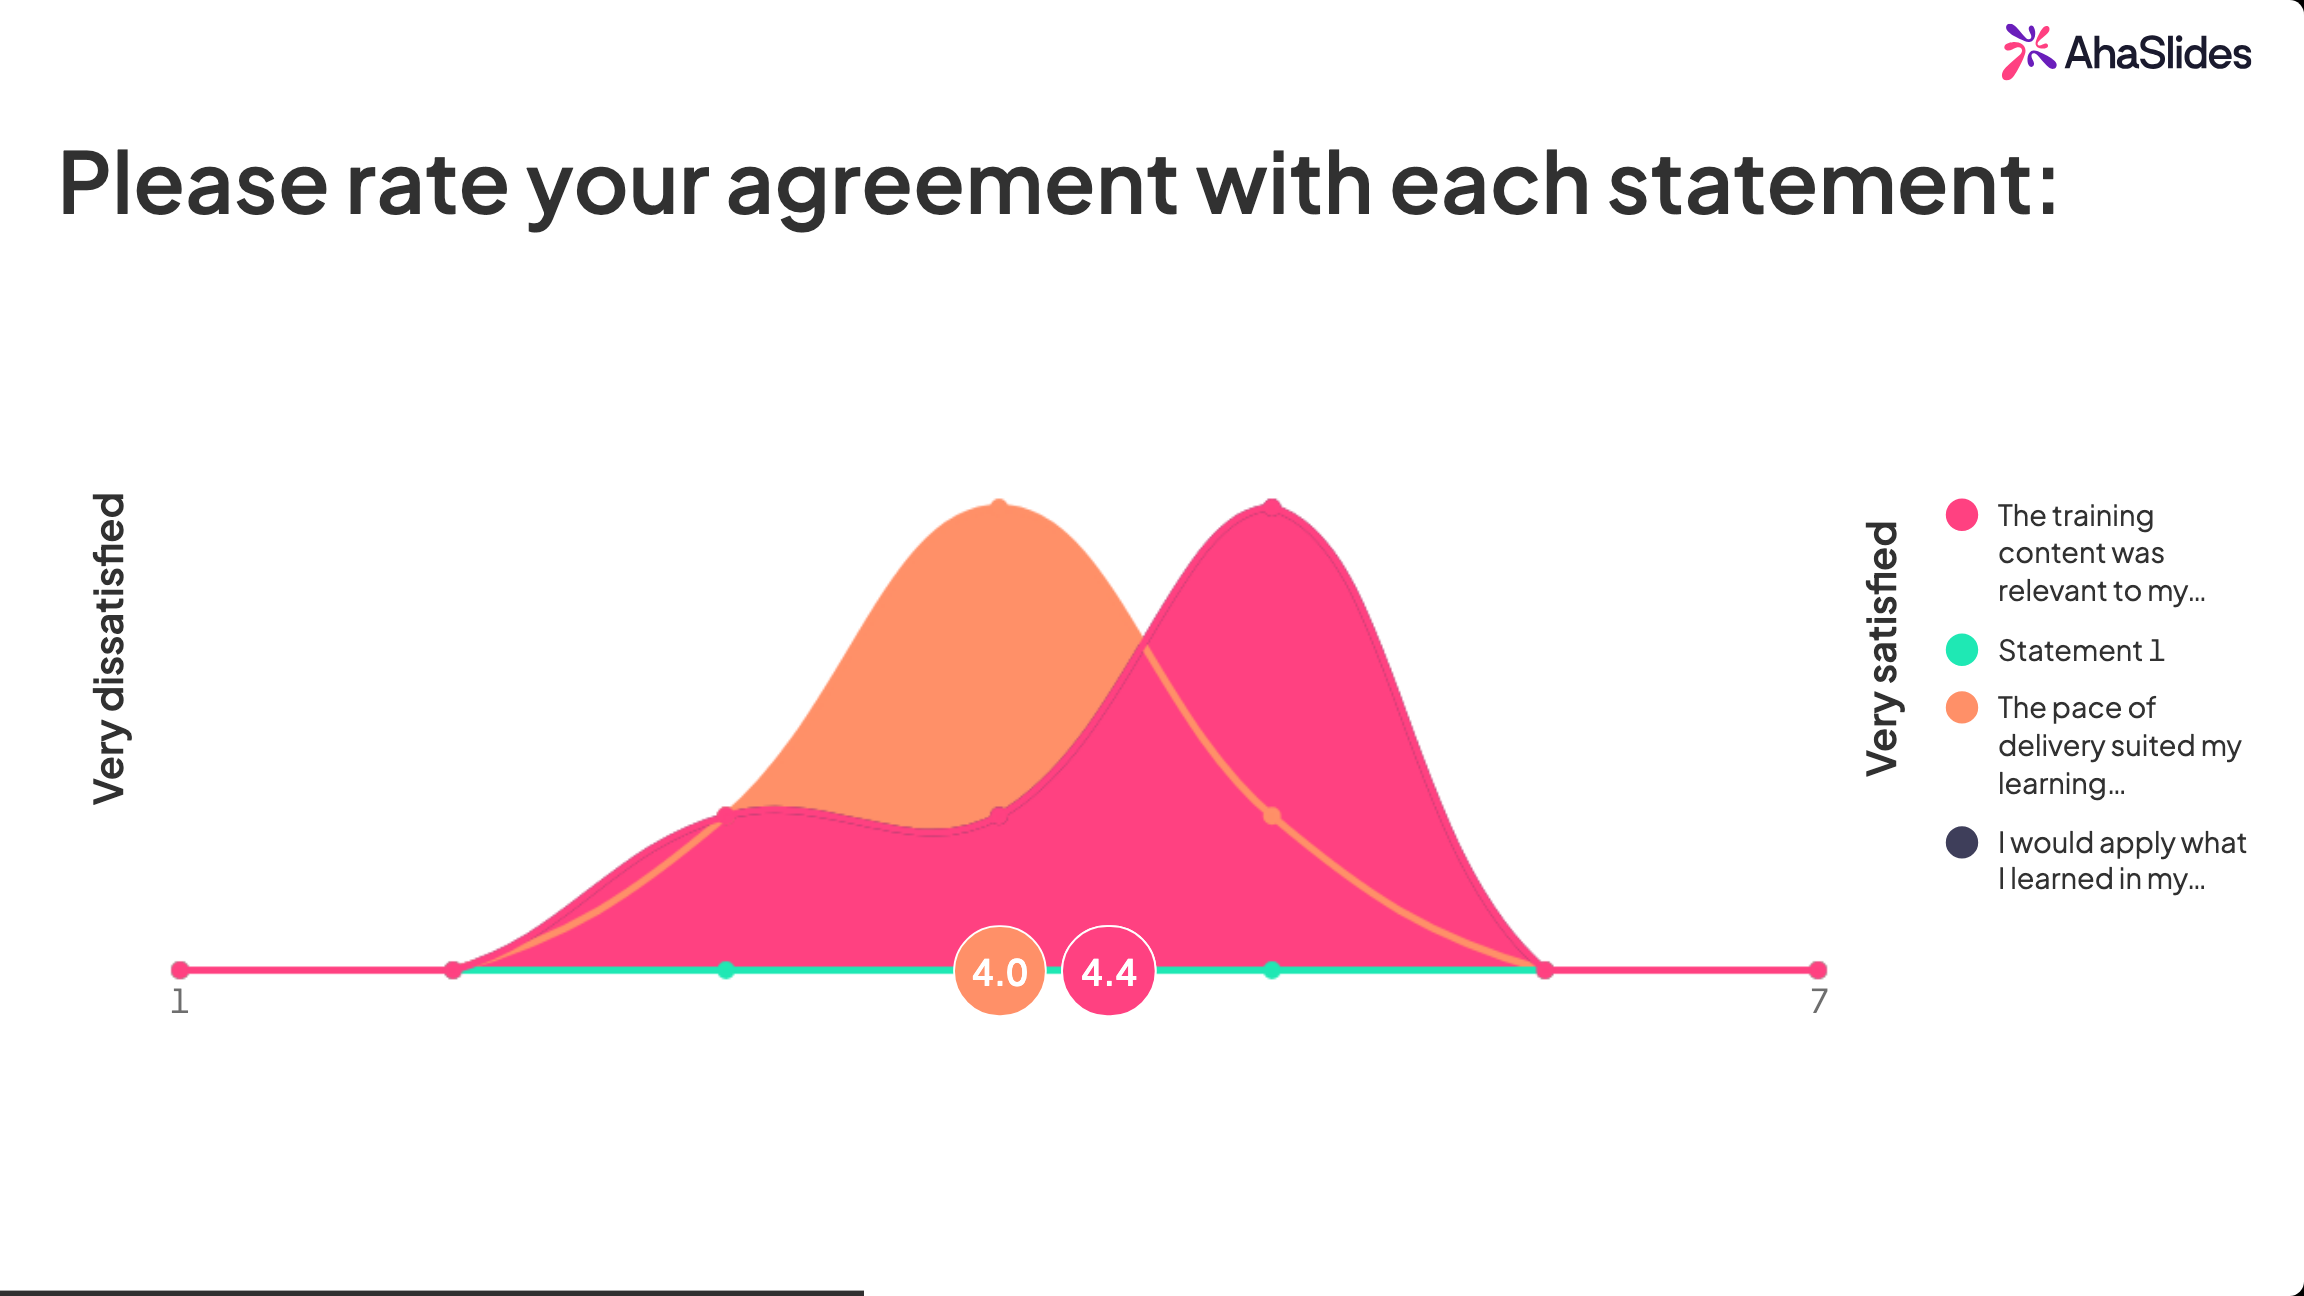
Am besten geeignet zur Messung von Einstellungen, Meinungen und Wahrnehmungen über mehrere zusammenhängende Dimensionen hinweg. Sie eignen sich hervorragend für Mitarbeiterbefragungen und Schulungsbewertungen, bei denen Sie messen möchten, wie stark die Menschen bestimmte Aspekte einer Erfahrung bewerten. Beispiel:
„Die Schulungsinhalte waren direkt relevant für meine Tätigkeit.“
Achten Sie auf mögliche Umfragemüdigkeit durch zu viele Likert-Items hintereinander. Studien zum Satisficing in Umfragen empfehlen, Likert-Skalen auf maximal 10 Zeilen pro Block zu beschränken; andernfalls neigen Befragte dazu, für jedes Item dieselbe Antwort auszuwählen, ohne die Fragen sorgfältig zu lesen [2]. Unterbrechen Sie lange Likert-Abschnitte mit anderen Fragetypen.
4. Offene Fragen
Offene Fragen laden zu freien Antworten ohne vorgegebene Optionen ein. Sie erfassen den qualitativen Kontext, der bei strukturierten Fragen verloren geht.
Am besten geeignet, um das „Warum“ hinter quantitativen Daten zu verstehen, unerwartete Themen aufzudecken und Vorschläge in den Worten der Befragten festzuhalten. Beispiele:
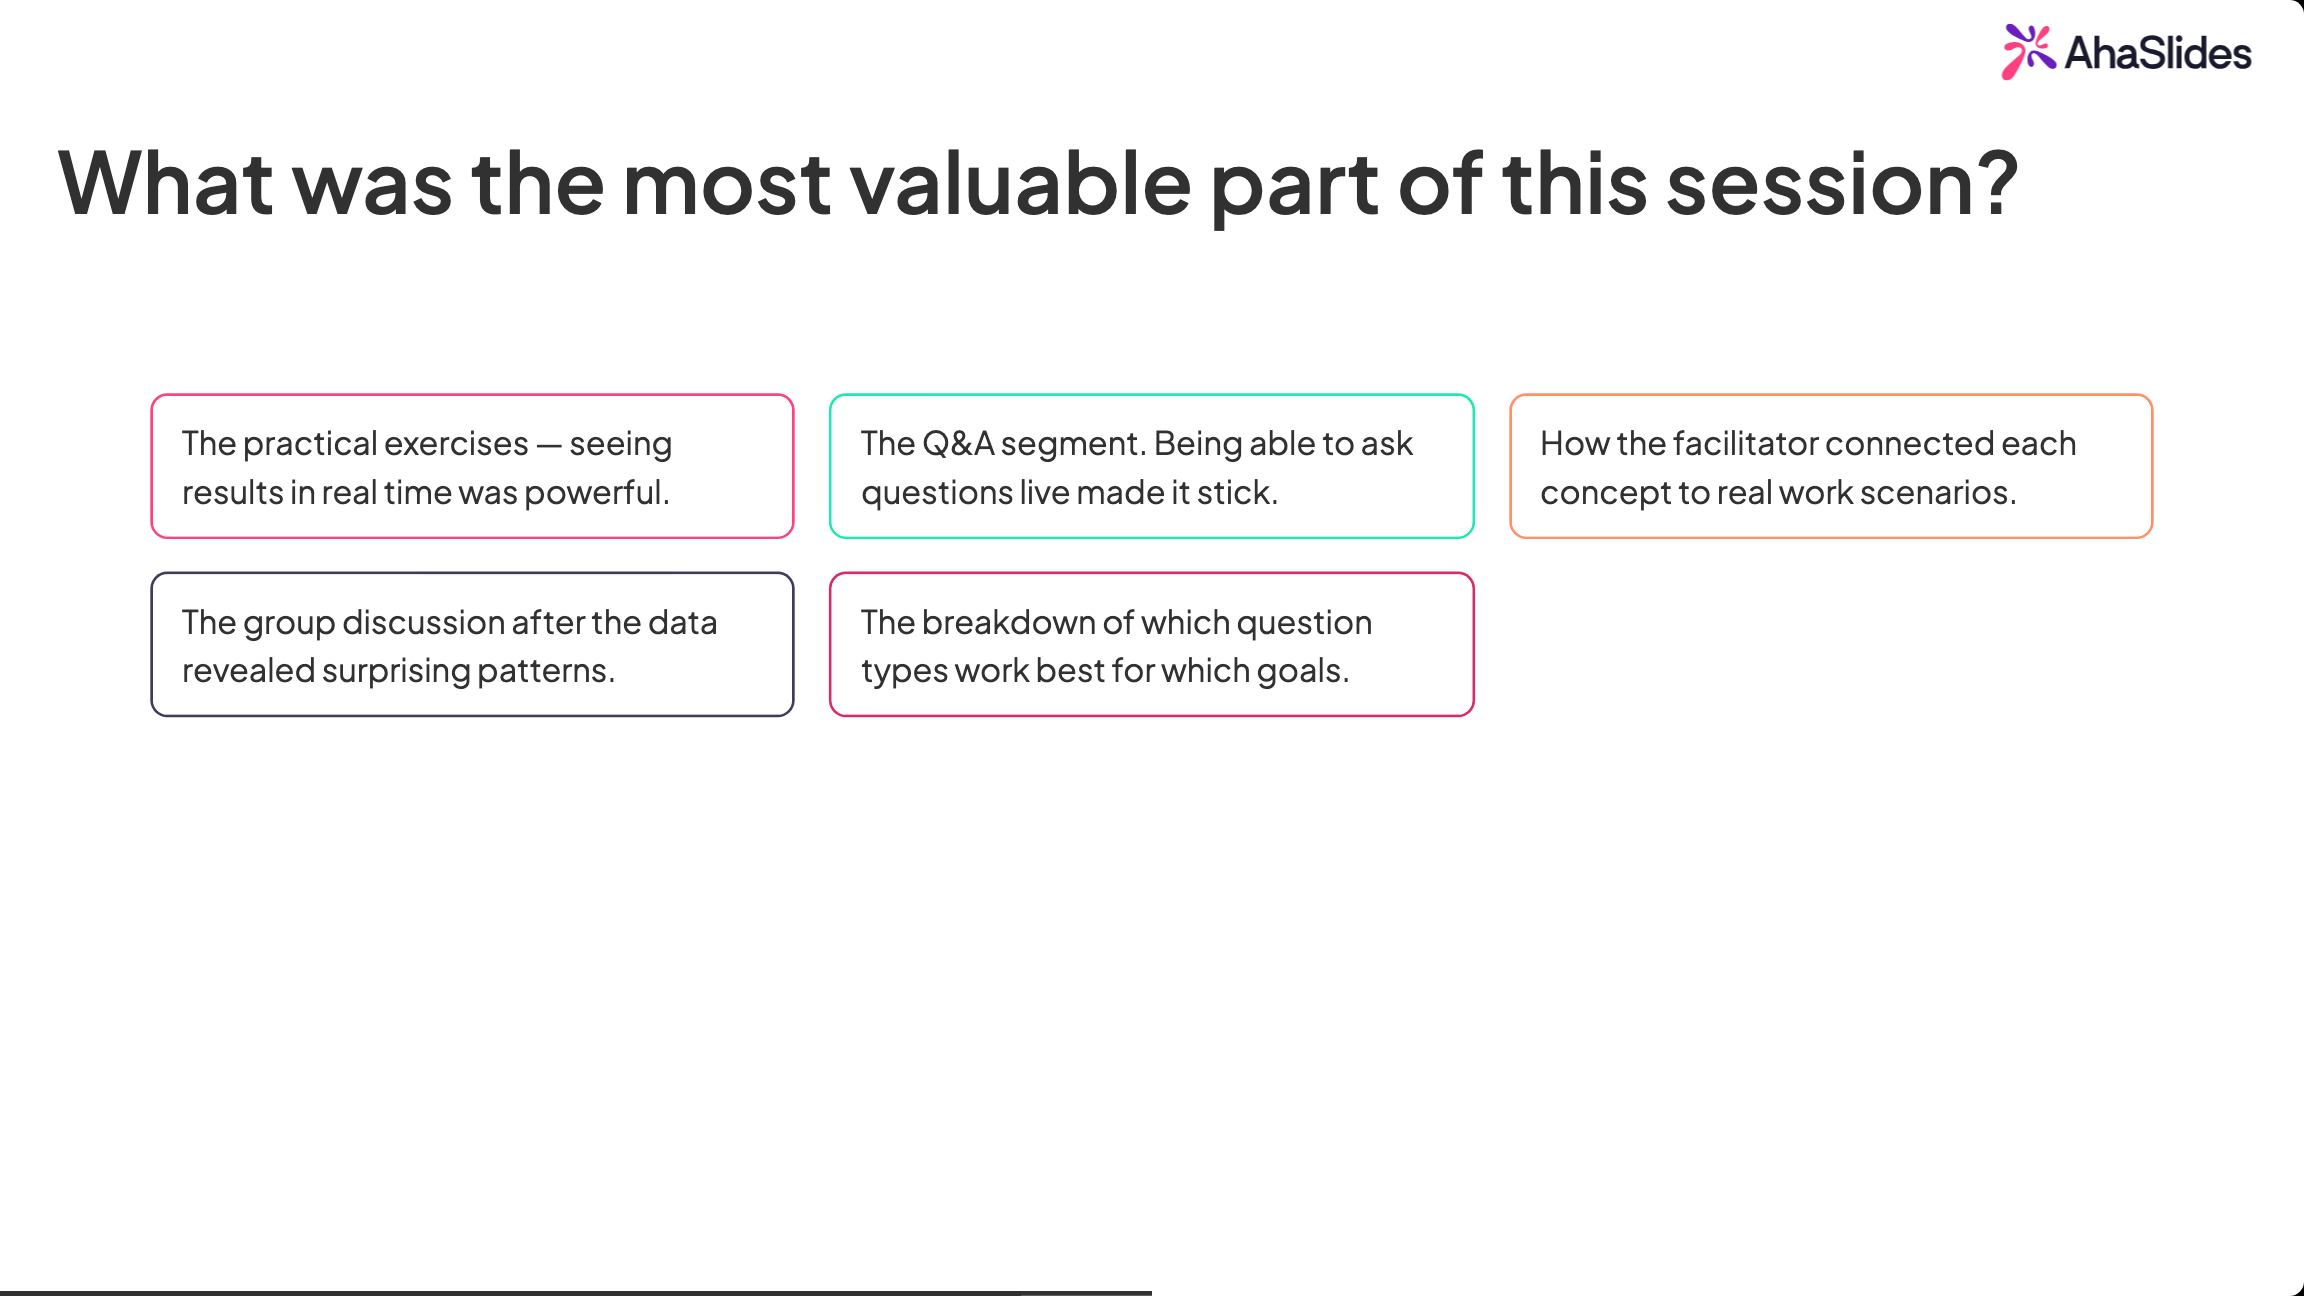
- "Was war der wertvollste Teil dieser Sitzung?"
- "Welche Änderung würde Ihre Erfahrung am meisten verbessern?"
Beschränken Sie sich auf ein bis zwei offene Fragen pro Umfrage und platzieren Sie diese am Ende, nach den strukturierten Fragen. Die Antwortraten sinken bei offenen Fragen, da diese mehr Aufwand erfordern. Die Analyse erfordert zudem eine thematische Kodierung, die bei großen Stichproben zeitaufwändig ist. Als schnelle Lösung in Live-Sitzungen können Sie die Antworten laut vorlesen und die Gruppe bitten, die am häufigsten genannten Themen zu diskutieren.
5. Rangordnungsfragen
Rangordnungsfragen fordern die Befragten auf, Elemente nach Priorität, Präferenz oder Wichtigkeit zu ordnen. Im Gegensatz zu Multiple-Choice-Fragen erzwingen sie Abwägungen und zeigen so, was im Verhältnis zu anderen Optionen am wichtigsten ist.
Rangordnungsfragen sind ein Format der erzwungenen Wahl in Umfragen. Sie verhindern, dass die Befragten stillschweigend alles als „sehr wichtig“ markieren, und zwingen sie, sich auf eine Reihenfolge festzulegen, wodurch die tatsächlichen Prioritäten deutlich werden.
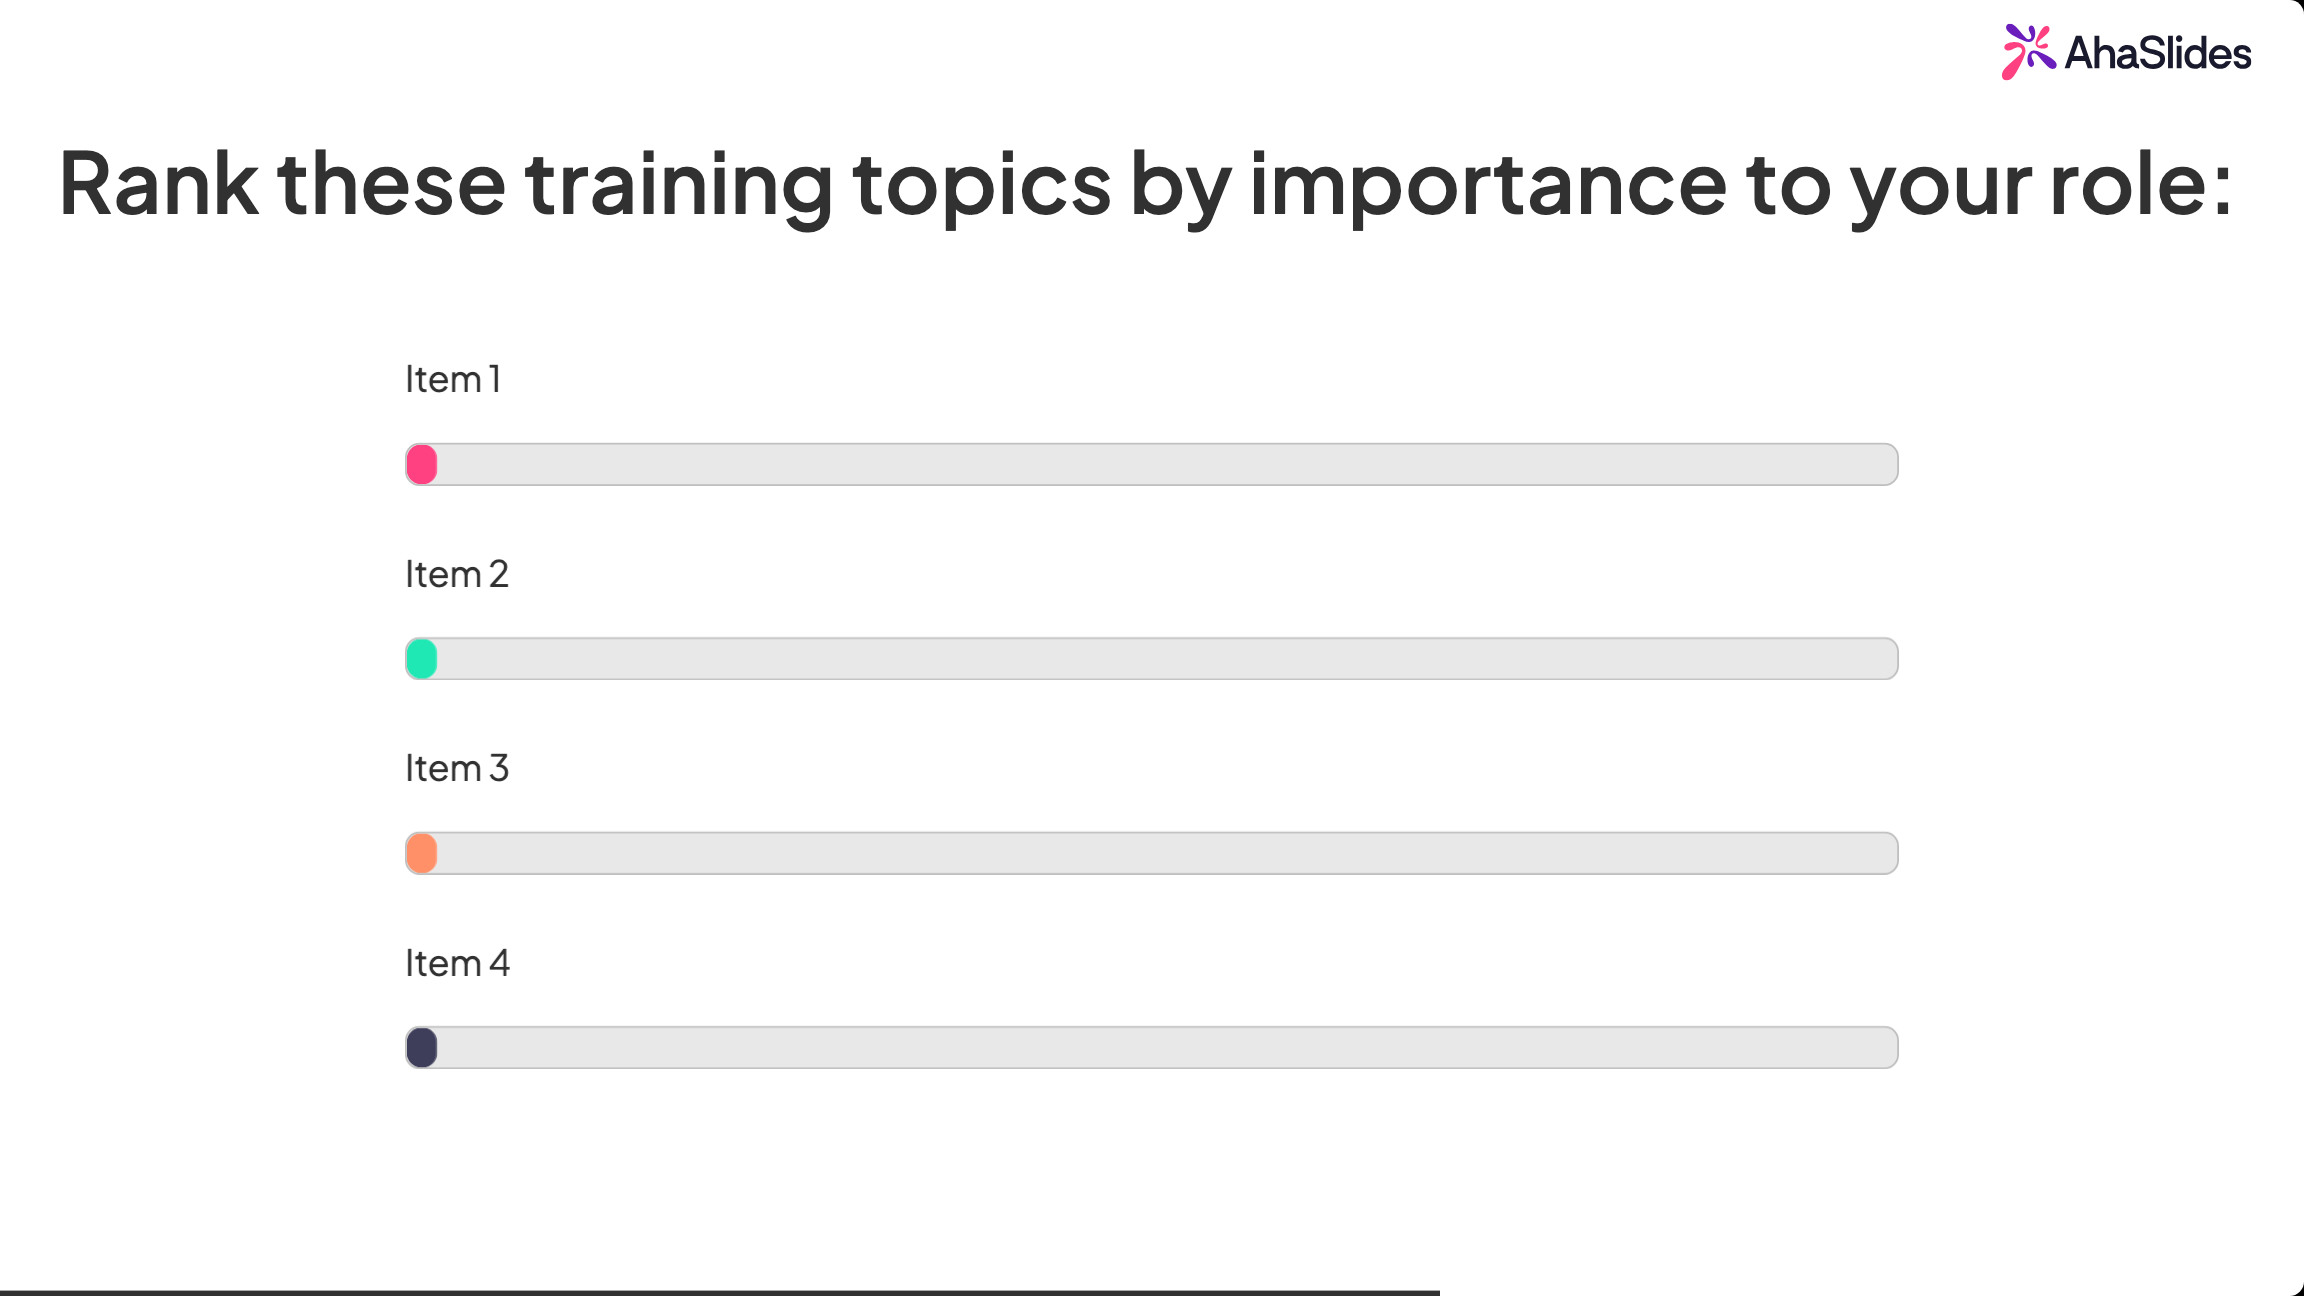
Am besten geeignet für Priorisierungsübungen und zum Verständnis relativer Präferenzen. Beispiel:
„Ordnen Sie die folgenden Schulungsthemen nach ihrer Wichtigkeit für Ihre Rolle: KI-Kenntnisse, Kommunikationsfähigkeiten, Führungskräfteentwicklung, Sensibilisierung für Cybersicherheit, Datenkompetenz.“
Achten Sie auf die kognitive Belastung. Das Bewerten von mehr als fünf bis sieben Elementen ist frustrierend und führt zu unzuverlässigen Daten. Halten Sie die Liste kurz und verwenden Sie klar unterscheidbare Optionen.
6. Matrixfragen
Matrixfragen verwenden ein Rasterformat, in dem die Zeilen die einzelnen Elemente und die Spalten eine einheitliche Skala darstellen. Sie ermöglichen es den Befragten, mehrere zusammenhängende Elemente auf derselben Skala zu bewerten, ohne das Frageformat wiederholen zu müssen.
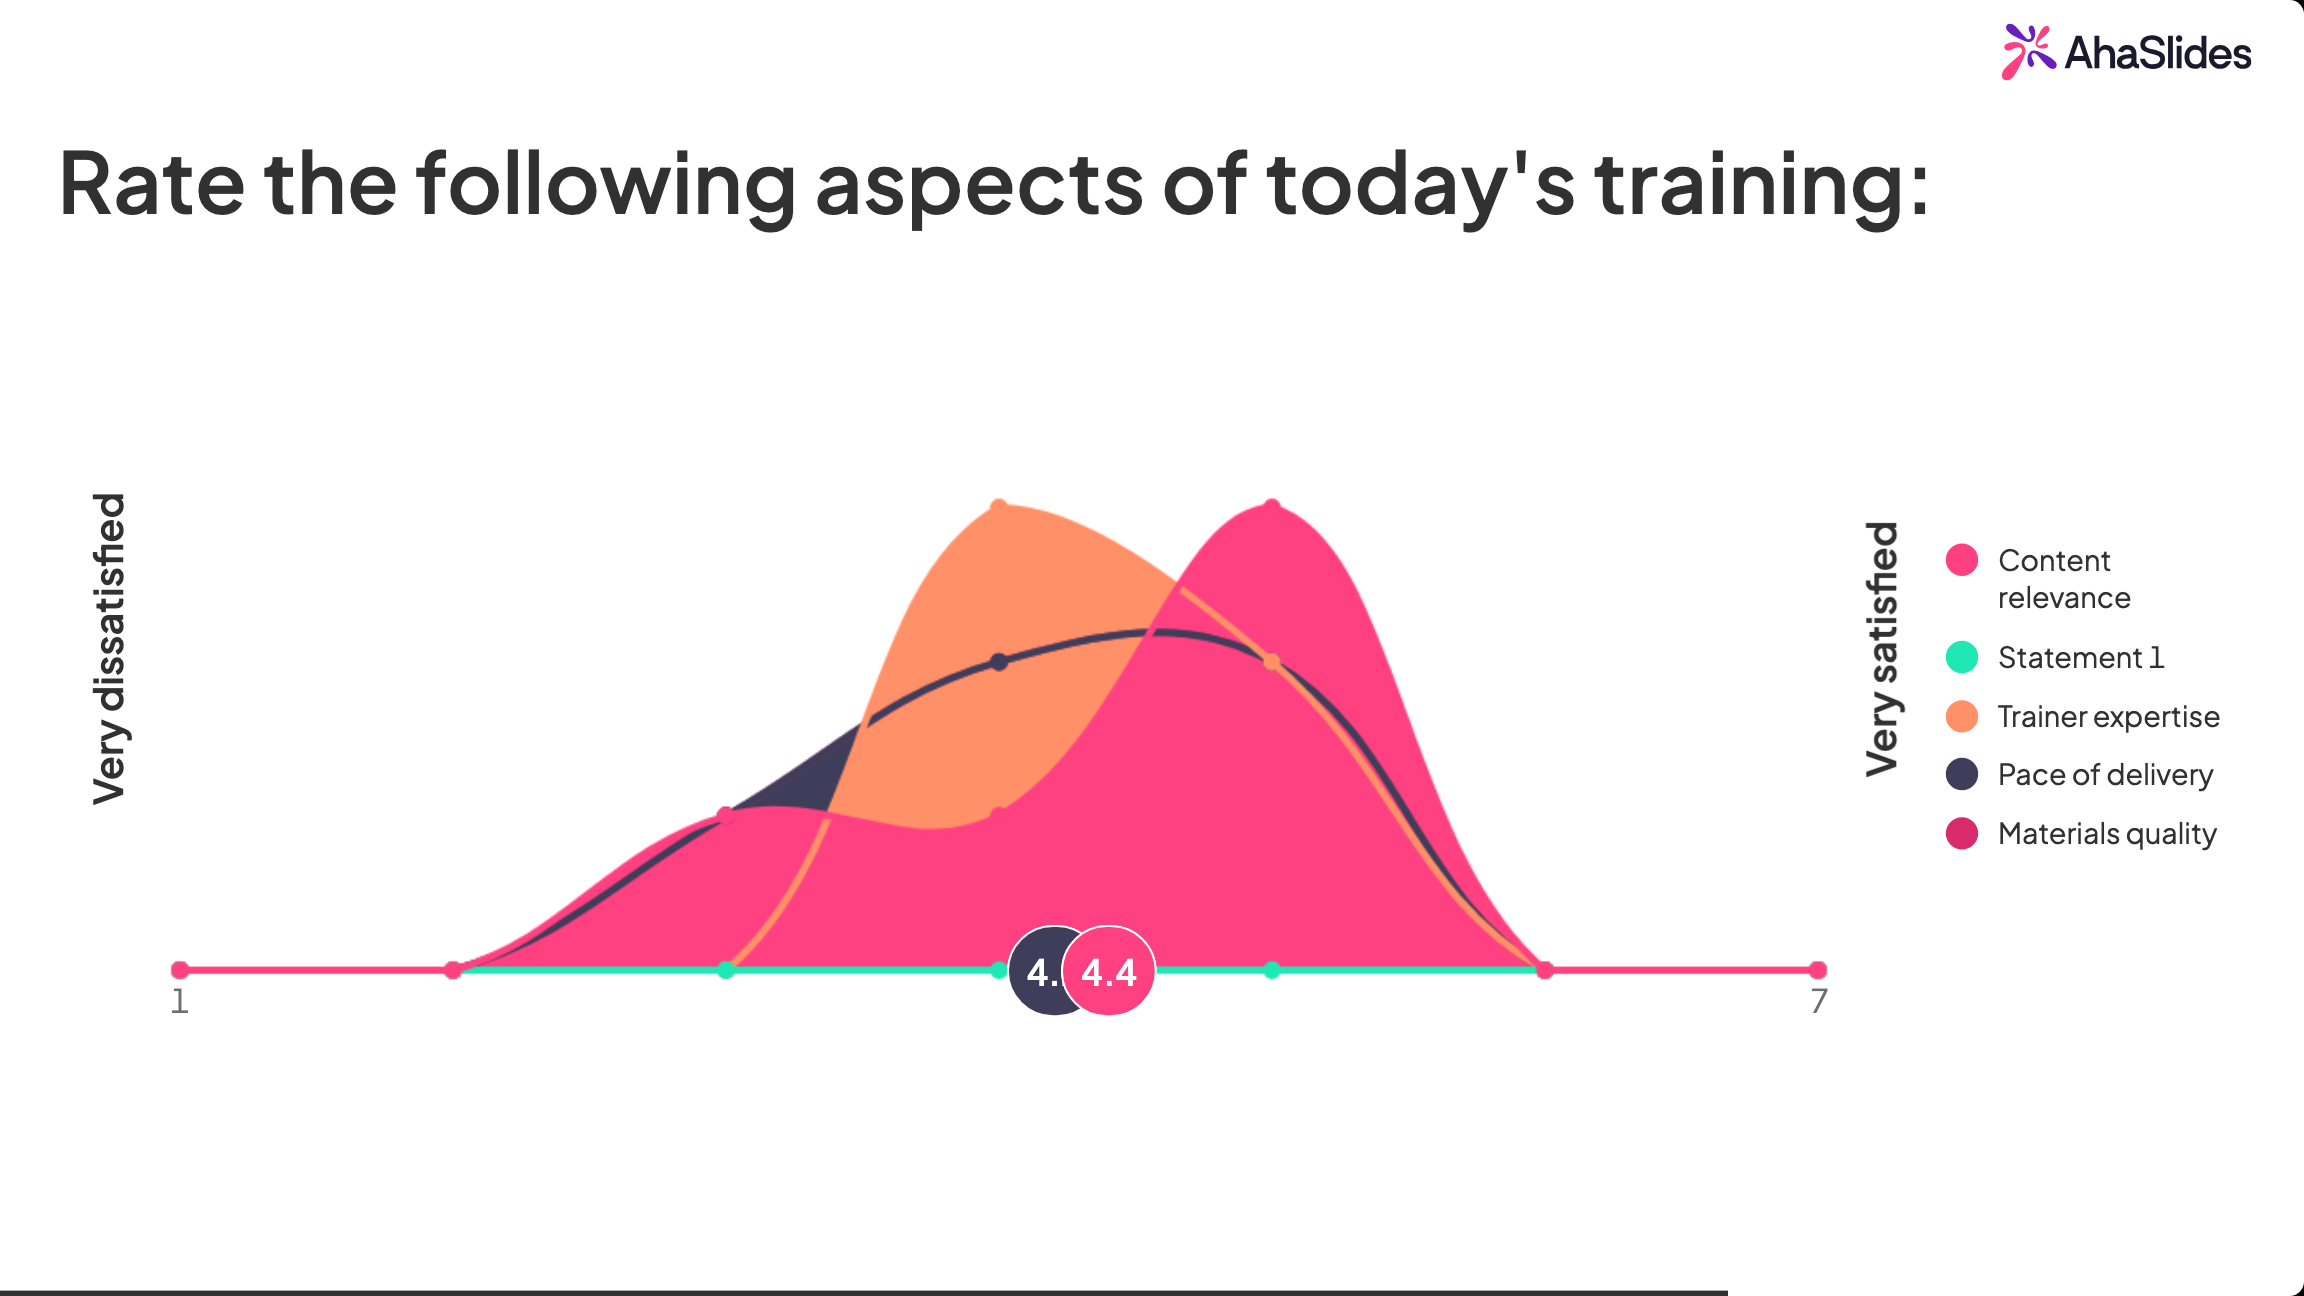
Ideal zum Vergleich von Bewertungen hinsichtlich verschiedener Aspekte derselben Erfahrung. Ein praktisches Beispiel: eine Bewertungsmatrix nach dem Training mit Zeilen für „Relevanz der Inhalte“, „Kompetenz des Trainers“, „Tempo“ und „Qualität der Materialien“, jeweils bewertet auf einer 5-Punkte-Skala. Vier Bewertungen, eine Ansicht.
Achten Sie auf die visuelle Komplexität auf Mobilgeräten. Große Matrizen sind auf kleinen Bildschirmen schwer lesbar, was zu unvorhersehbaren Antworten führen kann. Beschränken Sie Matrizen auf maximal fünf oder sechs Zeilen und testen Sie sie auf Mobilgeräten, bevor Sie sie einem breiteren Publikum zugänglich machen.
7. Dichotome (Ja/Nein-)Fragen

Dichotome Fragen bieten genau zwei Antwortmöglichkeiten, typischerweise Ja/Nein oder Richtig/Falsch. Sie sind die schnellste Frageform, sowohl zum Schreiben als auch zum Beantworten.
Ideal zum Sichten, Filtern und schnellen Faktencheck. Beispiele:
- "Haben Sie an der gesamten Schulung teilgenommen? (Ja / Nein)"
- "Haben Sie die neue Software seit der Schulung benutzt? (Ja / Nein)"
Sie funktionieren gut als Logikgatter, die die Befragten je nach ihrer Antwort zu verschiedenen Folgefragen weiterleiten. Ein „Nein“ bei der Teilnahmefrage könnte dazu führen, dass die Befragten die Sitzungsbewertung überspringen und direkt zum demografischen Abschnitt gelangen.
Achten Sie auf Vereinfachungen. Ein einfaches „Nein“ sagt nichts über die Gründe aus. Ergänzen Sie dichotome Fragen mit einer kurzen offenen Frage oder einer Bewertungsskala, um die nötigen Details zu erfassen.
8. Demografische Fragen

Demografische Fragen erfassen Hintergrundinformationen über die Befragten und ermöglichen so eine segmentierte Analyse. Gängige Dimensionen sind Abteilung, Funktion, Betriebszugehörigkeit, Standort und Erfahrungsniveau.
Am besten geeignet für Kreuztabellen und Gruppenvergleiche. Die Erkenntnis, dass Mitarbeiter einer Abteilung die Effektivität von Schulungen deutlich niedriger bewerten als der Unternehmensdurchschnitt, ist wesentlich aussagekräftiger als eine einzelne Gesamtbewertung.
Demografische Fragen sollten optional sein. Erläutern Sie den Zweck der Datenerhebung und wahren Sie die Anonymität, indem Sie zu kleine Segmente vermeiden, die die Identifizierung einzelner Personen ermöglichen. Üblicherweise werden Daten auf Gruppenebene erst ab fünf Befragten pro Segment veröffentlicht.
Alles zusammengefasst: Gestaltung eines Umfrageablaufs
Eine gut strukturierte Umfrage folgt einem logischen Ablauf. Beginnen Sie mit einfachen Screening- oder demografischen Fragen, um die Befragten einzubinden. Gehen Sie dann zu Ihren zentralen Messfragen über: Bewertungsskalen, Likert-Skalen, Matrixfragen. Schließen Sie mit ein oder zwei offenen Fragen ab, um die qualitative Tiefe zu erfassen.
Die Bearbeitungszeit sollte fünf bis sieben Minuten nicht überschreiten. Untersuchungen von SurveyMonkey zeigen, dass Umfragen unter sieben Minuten deutlich höhere Abschlussquoten aufweisen als längere Umfragen; die Abbruchraten steigen nach 12 Minuten rapide an [3]. Dies entspricht etwa 10–15 Fragen, abhängig vom Fragetyp.
Häufige Fehler zu vermeiden
Selbst wenn man die richtigen Fragetypen auswählt, können einige Gestaltungsgewohnheiten die Qualität der Antworten unbemerkt beeinträchtigen.
1. Doppelte Fragen stellen
Eine Doppelfrage fasst zwei unterschiedliche Aussagen in einer einzigen Aussage zusammen: „Die Schulungsinhalte waren relevant und die Materialien leicht verständlich.“ Ein Befragter, der die Inhalte zwar als relevant, die Materialien aber als verwirrend empfand, kann keine ehrliche Antwort geben. Teilen Sie daher jede zusammengesetzte Aussage in eine separate Frage auf. Dies ist besonders häufig bei Umfragen im Likert-Format der Fall, wo die Autoren versuchen, durch die Zusammenfassung von Ideen effizienter zu sein.
2. Verwendung einer suggestiven Sprache
Fragen, die auf eine erwartbare Antwort hindeuten, verfälschen positive Bewertungen und machen Vergleiche im Zeitverlauf sinnlos. „Wie sehr hat Ihnen die heutige Sitzung gefallen?“ setzt Freude voraus. „Wie würden Sie die heutige Sitzung insgesamt bewerten?“ tut dies nicht. Überprüfen Sie jede Frage auf Wörter, die eine bevorzugte Antwort implizieren, und ersetzen Sie diese durch neutrale Formulierungen.
3. Unausgewogene Antwortmöglichkeiten anbieten
Eine Bewertungsskala mit vier positiven und einer negativen Option („Ausgezeichnet / Sehr gut / Gut / Durchschnittlich / Schlecht“) ist nicht ausgewogen. Befragte mit einer negativen Einstellung haben nur begrenzte Auswahlmöglichkeiten, und die Durchschnittswerte steigen unabhängig von der tatsächlichen Erfahrung. Bei jeder Skala, die von negativ nach positiv verläuft, sollte die Anzahl der Optionen auf beiden Seiten des Mittelpunkts übereinstimmen. Eine Standard-5-Punkte-Skala eignet sich gut: zwei negative, eine neutrale und zwei positive Optionen. Wenn Sie keinen neutralen Mittelpunkt wünschen, verwenden Sie eine Skala mit gerader Anzahl an Punkten (4 oder 6), die eine eindeutige Antwort erfordert.
4. Die wichtigsten Fragen unter den Teppich kehren
Umfragemüdigkeit ist ein reales Problem, und die Beteiligung sinkt mit zunehmender Länge der Umfrage. Steht Ihre wichtigste Frage erst an 14. von 15 Stellen, erreichen viele Befragte sie möglicherweise nie mit voller Aufmerksamkeit oder gar nicht. Platzieren Sie Ihre wichtigsten Fragen in der ersten Hälfte der Umfrage. Demografische Daten und optionale offene Fragen gehören ans Ende, wo die Abbruchrate weniger ins Gewicht fällt.
Häufig gestellte Fragen
Wie viele Fragen sollte eine Umfrage enthalten?
Für Schulungsevaluationen und Feedback nach Veranstaltungen sind 8 bis 12 Fragen ein bewährter Rahmen. Das entspricht in der Regel einer Bearbeitungszeit von fünf bis sieben Minuten, in der die Rücklaufquote am höchsten ist. Ist Ihre Umfrage länger, überlegen Sie, ob jede Frage tatsächlich eine Entscheidung beeinflusst. Fragen, deren Daten keine Konsequenzen haben, sollten gestrichen werden. Ein hilfreicher Test vor der endgültigen Fertigstellung der Umfrage: Notieren Sie für jede Frage, welche Entscheidung oder Maßnahme durch sie beeinflusst werden soll. Können Sie diese Frage nicht beantworten, ist sie wahrscheinlich überflüssig. So stellen Sie sicher, dass der Zweck der Umfrage klar definiert ist, bevor Sie sie versenden.
Worin besteht der Unterschied zwischen einer Bewertungsskala und einer Likert-Skala?
Eine Bewertungsskala ordnet einer Aussage eine Zahl zu: „Bewerten Sie dies auf einer Skala von 1 bis 5.“ Eine Likert-Skala präsentiert eine Aussage und fragt, inwieweit der Befragte ihr zustimmt: „Der Moderator hat die Konzepte klar erklärt. (Stimme überhaupt nicht zu bis Stimme voll und ganz zu).“ Beide sind Ordinalskalen, aber Likert-Items werden immer mit einer Aussage kombiniert, während Bewertungsskalen für nahezu jede Bewertungsaufgabe geeignet sind.
Wann sollte man offene Fragen anstelle von strukturierten Fragen verwenden?
Verwenden Sie offene Fragen, wenn Sie noch nicht wissen, welche Kategorien relevant sind oder wenn Sie vermuten, dass die vorgegebenen Antwortmöglichkeiten nicht alle Aspekte erfassen. Sie sind besonders nach dem Start eines neuen Programms hilfreich, um herauszufinden, was auffällt, bevor Sie genügend Daten für ein Bewertungssystem haben. Bei wiederkehrenden Umfragen zu einem festen Thema lassen sich vorgegebene Antwortmöglichkeiten schneller analysieren und im Zeitverlauf leichter nachverfolgen. Ein praktischer Ansatz ist, in der ersten Runde einer neuen Umfrage ein oder zwei offene Fragen zu stellen, die häufigsten Themen zu identifizieren und diese dann für zukünftige Runden in vorgegebene Antwortmöglichkeiten umzuwandeln.
Umfragen mit AhaSlides durchführen
Die Wahl des richtigen Fragetyps ist nur die halbe Miete. Sie benötigen außerdem, dass die Befragten tatsächlich teilnehmen und die Umfrage ausfüllen.
AhaSlides ist eine All-in-One-Plattform für die Publikumsinteraktion, die Multiple-Choice-Fragen, Bewertungsskalen, offene Antworten, Ranking-Fragen und vieles mehr in einer einzigen Live-Session unterstützt. Erstellen Sie eine kurze Umfrage mit drei Fragen zur Mitte der Session, zeigen Sie die Ergebnisse auf dem Bildschirm an, während die Teilnehmer noch anwesend sind, und passen Sie die zweite Hälfte der Session entsprechend an. Ein separates Umfragetool ist nicht erforderlich.
Gerade bei Trainingsauswertungen verändert die Beobachtung der Gruppenreaktionen im Raum die Dynamik. Die anschließende Diskussion ist oft wertvoller als die Daten selbst. Wir haben festgestellt, dass Teams, die Ergebnisse gemeinsam betrachten, darauf reagieren, während Teams, die lediglich einen zusammenfassenden Bericht erhalten, dies selten tun.
Quellen
[1] Reichheld, F. (Dezember 2003). „Die eine Zahl, die Sie zum Wachsen brauchen.“ (Harvard Business Review). https://hbr.org/2003/12/the-one-number-you-need-to-grow
[2] Krosnick, JA (1991). „Antwortstrategien zur Bewältigung der kognitiven Anforderungen von Einstellungsmessungen in Umfragen.“ Angewandte Kognitive Psychologie, 5 (3), 213-236. https://doi.org/10.1002/acp.2350050305
[3] SurveyMonkey. „Wie lang sollte eine Umfrage sein?“ https://www.surveymonkey.com/curiosity/survey_completion_times/