
Špatně navržený dotazník stojí organizace každoročně miliony v důsledku ztráty času a chybných rozhodnutí. Výzkum Harvardova programu pro výzkum průzkumů ukazuje, že špatně sestavené průzkumy nejenže neshromažďují užitečná data – aktivně zavádějí osoby s rozhodovací pravomocí zaujatými, neúplnými nebo nesprávně interpretovanými odpověďmi.
Ať už jste personalista měřící angažovanost zaměstnanců, produktový manažer shromažďující zpětnou vazbu od uživatelů, výzkumník provádějící akademické studie nebo školitel hodnotící výsledky učení, principy návrhu dotazníků, které zde objevíte, jsou podloženy více než 40 lety empirického výzkumu institucí, jako je Pew Research Center, Imperial College London a od předních metodologů průzkumů.
Nejde o vytváření „dostatečně dobrých“ průzkumů. Jde o navrhování dotazníků, které respondenti skutečně vyplní, které eliminují běžné kognitivní zkreslení a které poskytují praktické informace, kterým můžete věřit.
Obsah
Proč většina dotazníků selže (a ten váš nemusí)
Podle výzkumu provedeného výzkumným centrem Pew Research Center není vývoj dotazníků umění – je to věda. Většina organizací však k návrhu dotazníků přistupuje intuitivně, což vede ke třem zásadním selháním:
- Zkreslení odpovědi: Otázky neúmyslně vedou respondenty k určitým odpovědím, čímž data ztrácejí na hodnotě.
- Zátěž respondenta: Průzkumy, které se zdají být obtížné, časově náročné nebo emocionálně vyčerpávající, vedou k nízké míře dokončení a nekvalitním odpovědím.
- Chyba měření: Nejasné otázky znamenají, že je respondenti interpretují odlišně, což znemožňuje smysluplnou analýzu dat.
Dobrá zpráva? Výzkum Imperial College London a dalších předních institucí identifikoval specifické, replikovatelné principy, které tyto problémy eliminují. Dodržujte je a míra odpovědí na dotazník se může zvýšit o 40–60 % a zároveň dramaticky zlepšit kvalitu dat.
Osm nezpochybnitelných charakteristik profesionálních dotazníků
Než se pustíte do vývoje otázek, ujistěte se, že váš dotazníkový rámec splňuje tato kritéria založená na důkazech:
- Křišťálová čistota: Respondenti přesně chápou, na co se ptáte. Nejednoznačnost je nepřítelem platných dat.
- Strategická stručnost: Stručné bez kompromisů v kontextu. Výzkum Harvardu ukazuje, že desetiminutové průzkumy dosahují o 25 % vyšší úspěšnosti vyplnění než dvacetiminutové verze.
- Specifičnost laseru: Obecné otázky vedou k vágním odpovědím. „Jak jste spokojeni?“ je slabá odpověď. „Jak jste spokojeni s dobou odezvy na váš poslední požadavek podpory?“ je silná odpověď.
- Nemilosrdná neutralita: Eliminujte vulgární výrazy. „Nesouhlasíte s tím, že náš produkt je vynikající?“ vnáší zaujatost. „Jak byste ohodnotili náš produkt?“ ne.
- Účelná relevance: Každá otázka se musí přímo týkat výzkumného cíle. Pokud nedokážete vysvětlit, proč se na ni ptáte, smažte ji.
- Logický tok: Seskupujte související otázky. Pohybujte se od obecných ke konkrétním. Citlivé demografické otázky umístěte na konec.
- Psychologická bezpečnost: U citlivých témat zajistěte anonymitu a důvěrnost. Jasně sdělte opatření na ochranu osobních údajů (důležité je dodržování GDPR).
- Bezproblémová reakce: Udělejte odpovědi intuitivní. Používejte vizuální hierarchii, bílý prostor a jasné formáty odpovědí, které fungují bez problémů napříč zařízeními.
Sedmikrokový proces návrhu dotazníku podpořený výzkumem
Krok 1: Definujte cíle s chirurgickou přesností
Nejasné cíle vedou k zbytečným dotazníkům. „Pochopit spokojenost zákazníků“ je příliš široké pojetí. Místo toho zvolte „Změřte NPS, identifikujte 3 největší problematická místa při nástupu do zaměstnání a určete pravděpodobnost obnovení smlouvy u podnikových zákazníků.“
Rámec pro stanovování cílů: Upřesněte typ výzkumu (explorativní, deskriptivní, vysvětlující nebo prediktivní). Specifikujte přesné potřebné informace. Přesně definujte cílovou populaci. Zajistěte, aby cíle řídily měřitelné výsledky, nikoli procesy.
Krok 2: Vypracujte otázky, které eliminují kognitivní zkreslení
Výzkum Imperial College ukazuje, že formáty odpovědí typu souhlas-nesouhlas patří mezi „nejhorší způsoby prezentace položek“, protože zavádějí zkreslení souhlasu – tendenci respondentů souhlasit bez ohledu na obsah. Tato jediná chyba může zneplatnit celou vaši datovou sadu.
Principy návrhu otázek založených na důkazech:
- Slovní položky jako otázky, nikoli tvrzení: „Jak užitečný byl náš tým podpory?“ překonává „Náš tým podpory byl užitečný (souhlasím/nesouhlasím)“.
- Použijte slovně označené stupnice: Označte každou možnost odpovědi („Vůbec neužitečné, Mírně užitečné, Přiměřeně užitečné, Velmi užitečné, Extrémně užitečné“), nikoli pouze koncové body. Tím se sníží chyba měření.
- Vyhněte se dvojtvárným otázkám: „Jak moc jste šťastní a angažovaní?“ ptá se na dvě věci. Oddělte je od sebe.
- Použijte vhodné formáty otázek: Uzavřená škála pro kvantitativní data (snadnější analýza). Otevřená škála pro kvalitativní poznatky (bohatší kontext). Likertova škála pro postoje (doporučeno 5–7 bodů).
Krok 3: Formát pro vizuální hierarchii a přístupnost
Výzkum ukazuje, že vizuální design přímo ovlivňuje kvalitu odpovědí. Špatné formátování zvyšuje kognitivní zátěž, což vede respondenty k uspokojení – poskytování nekvalitních odpovědí jen proto, aby doplnili odpověď.
Důležité pokyny pro formátování:
- Stejné vizuální rozestupy: Udržujte stejné vzdálenosti mezi body stupnice, abyste posílili pojmovou rovnost a snížili zkreslení.
- Samostatné nepodstatné možnosti: Pro vizuální odlišení přidejte před „N/A“ nebo „Raději neodpovídám“ další mezeru.
- Velkorysý bílý prostor: Snižuje kognitivní únavu a zlepšuje míru dokončení úkolů.
- Ukazatele pokroku: U digitálních průzkumů zobrazujte procento dokončení, abyste si udrželi motivaci.
- Optimalizace pro mobilní zařízení: Více než 50 % odpovědí na průzkumy nyní pochází z mobilních zařízení. Důkladně to otestujte.
Krok 4: Proveďte důkladné pilotní testování
Pew Research Center Před plným nasazením využívá rozsáhlé předběžné testování prostřednictvím kognitivních rozhovorů, fokusních skupin a pilotních průzkumů. To odhaluje nejednoznačné formulace, matoucí formáty a technické problémy, které ničí kvalitu dat.
Pilotní test s 10–15 zástupci cílové populace. Změřte dobu dokončení, identifikujte nejasné otázky, vyhodnoťte logický sled a shromažďujte kvalitativní zpětnou vazbu prostřednictvím následných rozhovorů. Opakovaně revidujte, dokud nezmizí zmatek.
Krok 5: Nasazení se strategickou distribucí
Způsob distribuce ovlivňuje míru odezvy a kvalitu dat. Vyberte si na základě svého publika a citlivosti obsahu:
- Digitální průzkumy: Nejrychlejší, nejlevnější, ideální pro škálovatelnost a data v reálném čase.
- Distribuce e-mailů: Vysoký dosah, možnosti personalizace, sledovatelné metriky.
- Osobní administrace: Vyšší míra odezvy, okamžité objasnění, lepší pro citlivá témata.
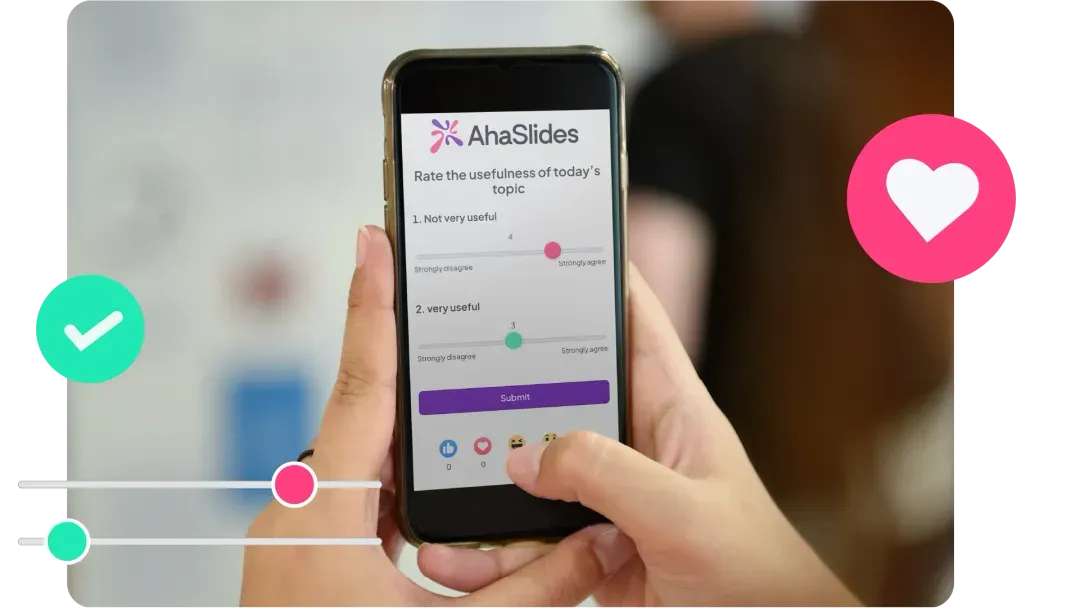
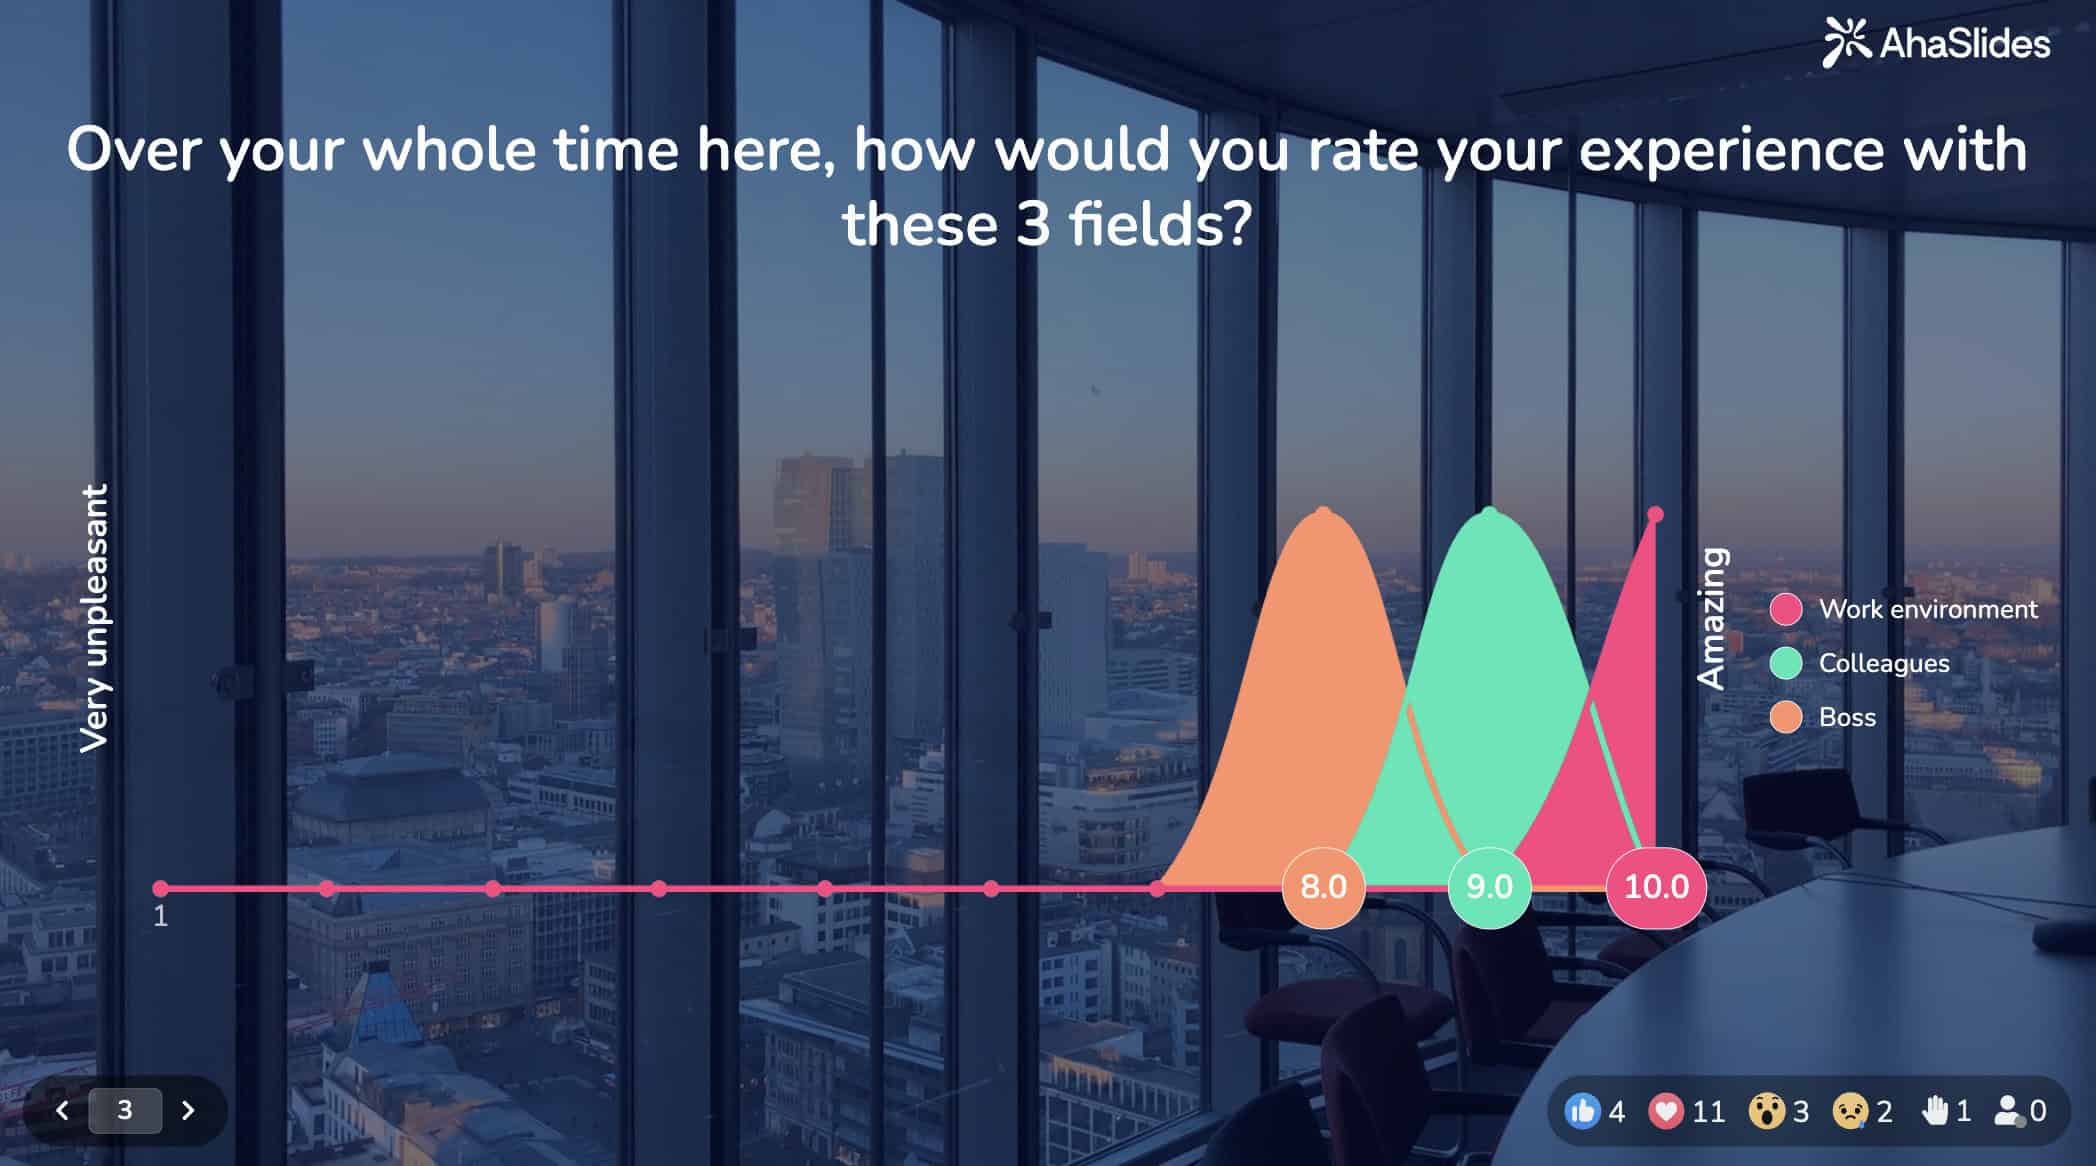
Tip pro profesionální zapojení: Používejte interaktivní platformy pro průzkumy, které umožňují synchronní i asynchronní účast a okamžitou vizualizaci výsledků. Nástroje jako AhaSlides může být skvělá volba.
Krok 6: Analýza dat se statistickou přesností
Systematicky sestavujte odpovědi pomocí tabulkového procesoru nebo specializovaných analytických nástrojů. Před dalším postupem zkontrolujte, zda nechybí data, zda neobsahují odlehlé hodnoty nebo nesrovnalosti.
U uzavřených otázek vypočítejte frekvence, procenta, průměry a mody. U otevřených odpovědí použijte tematické kódování k identifikaci vzorců. Použijte křížovou tabulku k odhalení vztahů mezi proměnnými. Zdokumentujte faktory ovlivňující interpretaci, jako je míra odpovědí a demografické zastoupení.
Krok 7: Interpretace zjištění ve správném kontextu
Vždy se vraťte k původním cílům. Identifikujte konzistentní témata a významné statistické vztahy. Všímejte si omezení a vnějších faktorů. Uveďte příklady odpovědí, které ilustrují klíčové poznatky. Identifikujte mezery vyžadující další výzkum. Prezentujte zjištění s patřičnou opatrností ohledně zobecnitelnosti.
Časté úskalí při návrhu dotazníků (a jak se jim vyhnout)
- Hlavní otázky: „Nemyslíš si, že X je důležité?“ → „Jak důležité je pro tebe X?“
- Předpokládané znalosti: Definujte odborné termíny nebo zkratky – ne každý zná váš oborový žargon.
- Překrývající se možnosti odpovědi: „0–5 let, 5–10 let“ vyvolává zmatek. Použijte „0–4 roky, 5–9 let“.
- Načtený jazyk: „Náš inovativní produkt“ vnáší zaujatost. Zůstaňte neutrální.
- Nadměrná délka: Každá další minuta snižuje míru dokončení o 3–5 %. Respektujte čas respondenta.
Jak vytvořit dotazník v AhaSlides
Zde jsou 5 jednoduchých kroků k vytvoření poutavého a rychlého průzkumu pomocí Likertovy stupnice. Stupnici můžete použít pro průzkumy spokojenosti zaměstnanců/služeb, průzkumy vývoje produktů/funkcí, zpětnou vazbu od studentů a mnoho dalších👇
Krok 1: Přihlaste se k odběru bezplatné AhaSlides účtu.
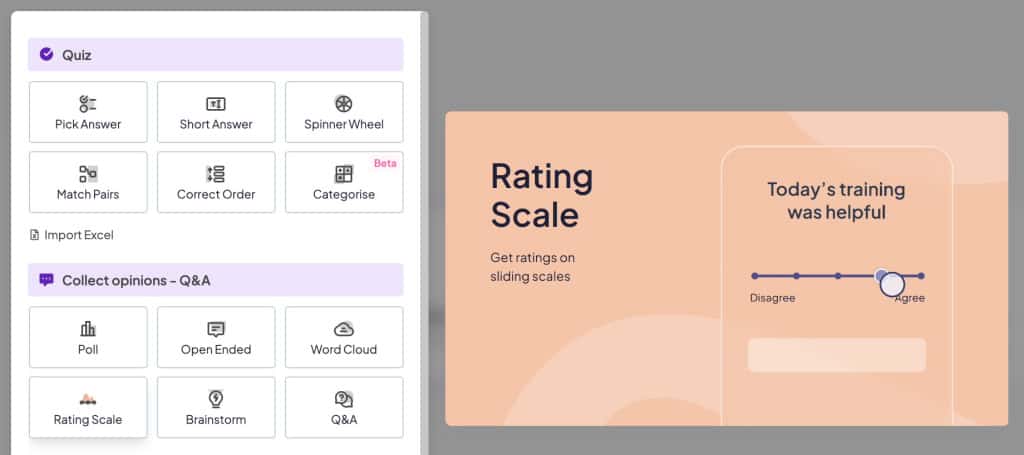
Krok 2: Vytvořte novou prezentaci nebo zamiřte k našemuKnihovna šablon“ a vezměte si jednu šablonu ze sekce „Průzkumy“.
Krok 3: Ve své prezentaci vyberte „Váhy' typ snímku.
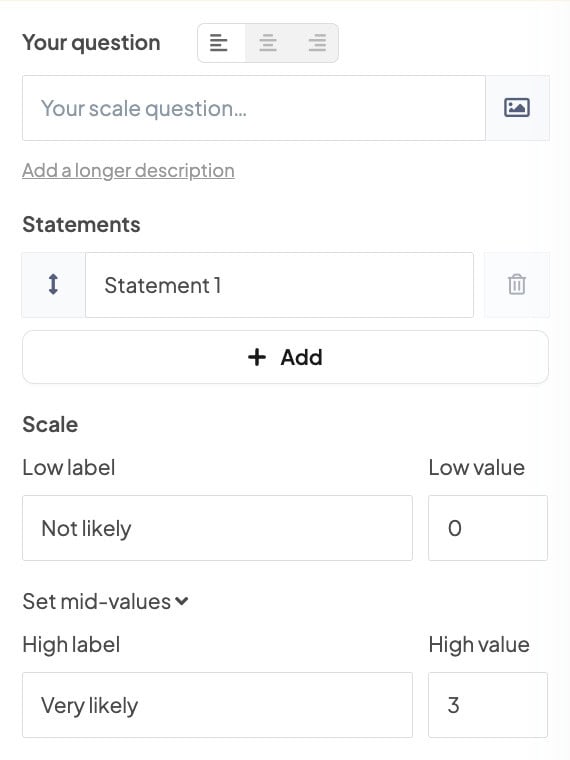
Krok 4: Zadejte každý výrok, aby ho účastníci ohodnotili, a nastavte stupnici od 1 do 5.
Krok 5: Pokud chcete, aby Chcete-li okamžitě získat přístup k průzkumu, klikněte na tlačítko „Současnost' tlačítko, aby si ho mohli prohlédnout jejich zařízení. Můžete také přejít do „Nastavení“ – „Kdo má vedení“ – a vybrat možnost „Publikum (s vlastním tempem)Možnost kdykoli shromáždit názory.
???? Tip: Klikněte na 'výsledky' vám umožní exportovat výsledky do Excel/PDF/JPG.
Často kladené dotazy
Co je pět kroků při navrhování dotazníku?
Pět kroků k návrhu dotazníku je č. 1 – definování cílů výzkumu, č. 2 – rozhodnutí o formátu dotazníku, č. 3 – vytvoření jasných a výstižných otázek, č. 4 – logické uspořádání otázek a č. 5 – předběžné otestování a upřesnění dotazníku .
Jaké jsou 4 typy dotazníků ve výzkumu?
Ve výzkumu jsou 4 typy dotazníků: Strukturovaný - Nestrukturovaný - Polostrukturovaný - Hybridní.
Jakých je 5 dobrých otázek v průzkumu?
5 dobrých otázek v průzkumu – co, kde, kdy, proč a jak je základních, ale zodpovězte je před zahájením průzkumu, pomůže vám to dosáhnout lepších výsledků.