
Thiết kế bảng câu hỏi kém khiến các tổ chức mất hàng triệu đô la mỗi năm do lãng phí thời gian và đưa ra quyết định sai lầm. Nghiên cứu từ Chương trình Nghiên cứu Khảo sát của Đại học Harvard cho thấy các cuộc khảo sát được xây dựng kém không chỉ không thu thập được dữ liệu hữu ích mà còn chủ động đánh lừa người ra quyết định bằng những câu trả lời thiên vị, không đầy đủ hoặc bị hiểu sai.
Cho dù bạn là chuyên gia nhân sự đo lường mức độ gắn kết của nhân viên, quản lý sản phẩm thu thập phản hồi của người dùng, nhà nghiên cứu thực hiện các nghiên cứu học thuật hay giảng viên đánh giá kết quả học tập, các nguyên tắc thiết kế bảng câu hỏi mà bạn khám phá ở đây đều được hỗ trợ bởi hơn 40 năm nghiên cứu thực nghiệm từ các tổ chức như Trung tâm nghiên cứu Pew, Đại học Hoàng gia London và các nhà phương pháp khảo sát hàng đầu.
Vấn đề không phải là tạo ra những khảo sát "đủ tốt". Vấn đề là thiết kế những bảng câu hỏi mà người trả lời thực sự hoàn thành, loại bỏ những định kiến nhận thức phổ biến và cung cấp thông tin hữu ích mà bạn có thể tin tưởng.
Mục lục
Tại sao hầu hết các bảng câu hỏi đều thất bại (và bảng câu hỏi của bạn thì không)
Theo nghiên cứu khảo sát của Trung tâm Nghiên cứu Pew, việc xây dựng bảng câu hỏi không phải là một nghệ thuật mà là một khoa học. Tuy nhiên, hầu hết các tổ chức đều tiếp cận thiết kế khảo sát một cách trực quan, dẫn đến ba sai lầm nghiêm trọng:
- Sự thiên vị trong phản ứng: Các câu hỏi vô tình dẫn dắt người trả lời đến những câu trả lời nhất định, khiến dữ liệu trở nên vô giá trị.
- Gánh nặng của người trả lời: Các cuộc khảo sát khó khăn, tốn thời gian hoặc gây tổn hại về mặt cảm xúc sẽ dẫn đến tỷ lệ hoàn thành thấp và chất lượng phản hồi kém.
- Lỗi đo lường: Những câu hỏi không rõ ràng có nghĩa là người trả lời sẽ hiểu chúng theo cách khác nhau, khiến dữ liệu của bạn không thể phân tích một cách có ý nghĩa.
Tin tốt là gì? Nghiên cứu từ Đại học Hoàng gia London và các tổ chức hàng đầu khác đã xác định các nguyên tắc cụ thể, có thể nhân rộng giúp loại bỏ những vấn đề này. Hãy tuân thủ chúng, tỷ lệ phản hồi bảng câu hỏi của bạn có thể tăng 40-60%, đồng thời cải thiện đáng kể chất lượng dữ liệu.
Tám đặc điểm không thể thương lượng của bảng câu hỏi chuyên môn
Trước khi bắt đầu xây dựng câu hỏi, hãy đảm bảo rằng khuôn khổ bảng câu hỏi của bạn đáp ứng các tiêu chí dựa trên bằng chứng sau:
- Độ trong suốt của tinh thể: Người trả lời hiểu chính xác những gì bạn đang hỏi. Sự mơ hồ là kẻ thù của dữ liệu hợp lệ.
- Sự ngắn gọn mang tính chiến lược: Ngắn gọn mà không làm mất đi ngữ cảnh. Nghiên cứu của Harvard cho thấy khảo sát 10 phút có tỷ lệ hoàn thành cao hơn 25% so với khảo sát 20 phút.
- Độ đặc hiệu của laser: Những câu hỏi chung chung thường đưa ra câu trả lời mơ hồ. "Bạn hài lòng đến mức nào?" là câu hỏi yếu. "Bạn hài lòng đến mức nào với thời gian phản hồi yêu cầu hỗ trợ gần nhất của bạn?" là câu hỏi mạnh.
- Sự trung lập tàn nhẫn: Loại bỏ ngôn ngữ dẫn dắt. "Bạn có đồng ý sản phẩm của chúng tôi tuyệt vời không?" sẽ gây ra sự thiên vị. "Bạn đánh giá sản phẩm của chúng tôi thế nào?" thì không.
- Sự liên quan có mục đích: Mỗi câu hỏi phải trực tiếp giải quyết một mục tiêu nghiên cứu. Nếu bạn không thể giải thích tại sao mình hỏi câu hỏi đó, hãy xóa nó.
- Luồng logic: Nhóm các câu hỏi liên quan lại với nhau. Chuyển từ tổng quát sang cụ thể. Đặt các câu hỏi nhân khẩu học nhạy cảm ở cuối.
- An toàn tâm lý: Đối với các chủ đề nhạy cảm, hãy đảm bảo tính ẩn danh và bảo mật. Truyền đạt rõ ràng các biện pháp bảo vệ dữ liệu (vấn đề tuân thủ GDPR).
- Phản ứng dễ dàng: Trả lời trực quan. Sử dụng hệ thống phân cấp trực quan, khoảng trắng và định dạng phản hồi rõ ràng, hoạt động liền mạch trên mọi thiết bị.
Quy trình thiết kế bảng câu hỏi dựa trên nghiên cứu gồm bảy bước
Bước 1: Xác định mục tiêu với độ chính xác phẫu thuật
Mục tiêu mơ hồ sẽ tạo ra những bảng câu hỏi vô ích. "Hiểu sự hài lòng của khách hàng" là quá chung chung. Thay vào đó, hãy: "Đo lường NPS, xác định 3 điểm cản trở hàng đầu trong quá trình tiếp nhận và xác định khả năng gia hạn của khách hàng doanh nghiệp."
Khung thiết lập mục tiêu: Làm rõ loại nghiên cứu của bạn (khám phá, mô tả, giải thích hoặc dự đoán). Chỉ định chính xác thông tin cần thiết. Xác định chính xác đối tượng mục tiêu. Đảm bảo mục tiêu hướng đến kết quả có thể đo lường được, chứ không phải quy trình.
Bước 2: Phát triển các câu hỏi loại bỏ định kiến nhận thức
Nghiên cứu của Đại học Hoàng gia chứng minh rằng định dạng phản hồi đồng ý-không đồng ý nằm trong số "những cách trình bày vấn đề tệ nhất" vì chúng tạo ra thiên kiến đồng tình - tức là người trả lời có xu hướng đồng ý bất kể nội dung. Chỉ riêng lỗi này cũng có thể làm mất hiệu lực toàn bộ tập dữ liệu của bạn.
Nguyên tắc thiết kế câu hỏi dựa trên bằng chứng:
- Các mục từ dưới dạng câu hỏi, không phải câu khẳng định: "Đội ngũ hỗ trợ của chúng tôi hữu ích như thế nào?" tốt hơn "Đội ngũ hỗ trợ của chúng tôi hữu ích (đồng ý/không đồng ý)."
- Sử dụng thang đo được dán nhãn bằng lời nói: Hãy dán nhãn cho mọi tùy chọn phản hồi ("Hoàn toàn không hữu ích, Ít hữu ích, Ít hữu ích, Rất hữu ích, Cực kỳ hữu ích") thay vì chỉ dán nhãn điểm cuối. Điều này giúp giảm lỗi đo lường.
- Tránh những câu hỏi có nội dung kép: "Bạn hạnh phúc và gắn bó đến mức nào?" hỏi hai điều. Hãy tách chúng ra.
- Áp dụng định dạng câu hỏi phù hợp: Câu hỏi đóng cho dữ liệu định lượng (dễ phân tích hơn). Câu hỏi mở cho thông tin định tính (bối cảnh phong phú hơn). Thang đo Likert cho thái độ (khuyến nghị 5-7 điểm).
Bước 3: Định dạng cho Phân cấp Trực quan và Khả năng Truy cập
Nghiên cứu cho thấy thiết kế trực quan ảnh hưởng trực tiếp đến chất lượng phản hồi. Định dạng kém làm tăng gánh nặng nhận thức, khiến người trả lời cảm thấy thỏa mãn - chỉ đưa ra câu trả lời chất lượng thấp để hoàn thành.
Hướng dẫn định dạng quan trọng:
- Khoảng cách thị giác bằng nhau: Duy trì khoảng cách đều nhau giữa các điểm trên thang đo để củng cố sự bình đẳng về mặt khái niệm và giảm sự thiên vị.
- Tách riêng các tùy chọn không có nội dung: Thêm khoảng trắng trước "N/A" hoặc "Không muốn trả lời" để phân biệt chúng một cách trực quan.
- Khoảng trắng rộng rãi: Giảm mệt mỏi về nhận thức và cải thiện tỷ lệ hoàn thành.
- Chỉ số tiến độ: Đối với các cuộc khảo sát kỹ thuật số, hãy hiển thị phần trăm hoàn thành để duy trì động lực.
- Tối ưu hóa di động: Hơn 50% phản hồi khảo sát hiện nay đến từ thiết bị di động. Hãy kiểm tra kỹ lưỡng.
Bước 4: Tiến hành thử nghiệm thí điểm nghiêm ngặt
Trung tâm nghiên cứu Pew sử dụng quy trình tiền kiểm tra mở rộng thông qua các cuộc phỏng vấn nhận thức, thảo luận nhóm tập trung và khảo sát thí điểm trước khi triển khai toàn diện. Quy trình này phát hiện ra những từ ngữ mơ hồ, định dạng khó hiểu và các vấn đề kỹ thuật làm giảm chất lượng dữ liệu.
Thử nghiệm thí điểm với 10-15 đại diện dân số mục tiêu. Đo lường thời gian hoàn thành, xác định những câu hỏi chưa rõ ràng, đánh giá tính logic và thu thập phản hồi định tính thông qua các cuộc trò chuyện tiếp theo. Ôn tập lại nhiều lần cho đến khi không còn nhầm lẫn nữa.
Bước 5: Triển khai với Phân phối Chiến lược
Phương pháp phân phối ảnh hưởng đến tỷ lệ phản hồi và chất lượng dữ liệu. Hãy lựa chọn dựa trên đối tượng và mức độ nhạy cảm của nội dung:
- Khảo sát kỹ thuật số: Nhanh nhất, tiết kiệm chi phí nhất, lý tưởng cho khả năng mở rộng và dữ liệu thời gian thực.
- Phân phối email: Phạm vi tiếp cận rộng, tùy chọn cá nhân hóa, số liệu có thể theo dõi.
- Quản lý trực tiếp: Tỷ lệ phản hồi cao hơn, giải thích rõ ràng ngay lập tức, phù hợp hơn với các chủ đề nhạy cảm.
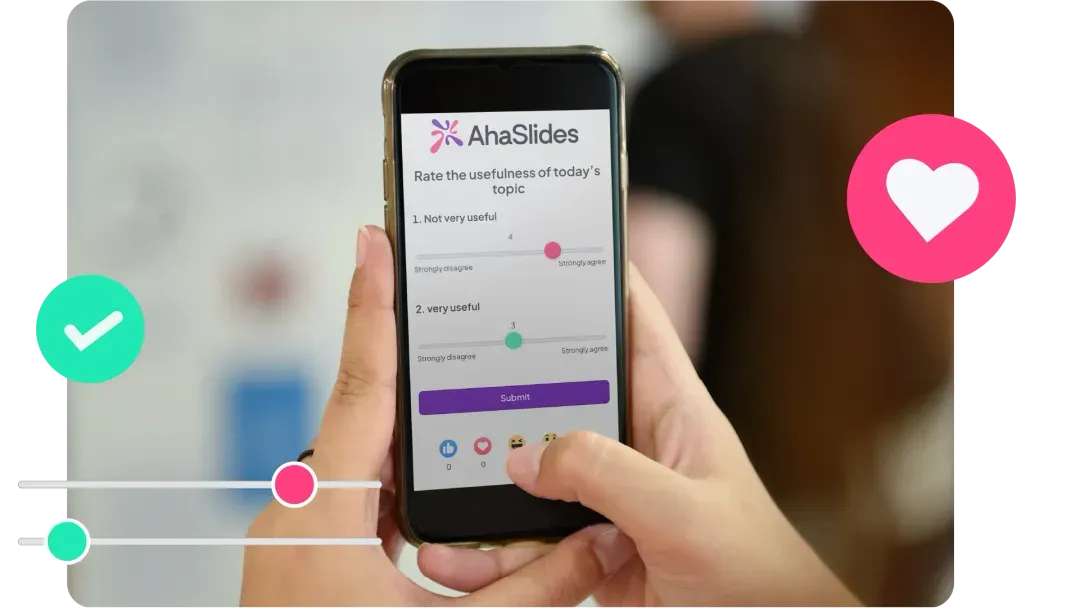
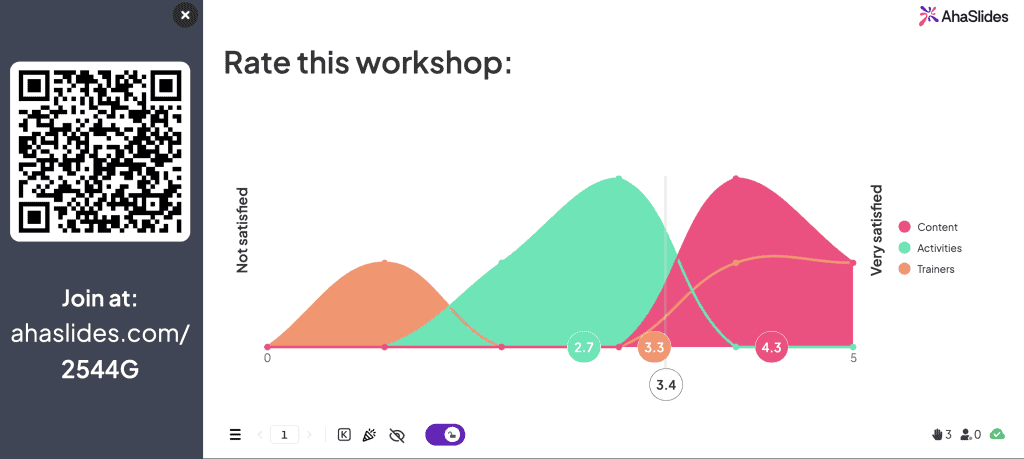
Mẹo thu hút chuyên nghiệp: Sử dụng nền tảng khảo sát tương tác cho phép tham gia đồng bộ và không đồng bộ cũng như trực quan hóa kết quả ngay lập tức. Các công cụ như AhaSlides có thể rất phù hợp.
Bước 6: Phân tích dữ liệu với độ chính xác thống kê
Biên soạn câu trả lời một cách có hệ thống bằng phần mềm bảng tính hoặc các công cụ phân tích chuyên dụng. Kiểm tra dữ liệu bị thiếu, giá trị ngoại lệ và sự không nhất quán trước khi tiếp tục.
Đối với câu hỏi đóng, hãy tính tần suất, tỷ lệ phần trăm, giá trị trung bình và mốt. Đối với câu trả lời mở, hãy áp dụng mã hóa theo chủ đề để xác định các mẫu. Sử dụng bảng chéo để làm rõ mối quan hệ giữa các biến. Ghi lại các yếu tố ảnh hưởng đến việc diễn giải, chẳng hạn như tỷ lệ trả lời và đặc điểm nhân khẩu học.
Bước 7: Diễn giải các phát hiện trong bối cảnh thích hợp
Luôn xem xét lại các mục tiêu ban đầu. Xác định các chủ đề nhất quán và các mối quan hệ thống kê quan trọng. Lưu ý các hạn chế và yếu tố bên ngoài. Trích dẫn các ví dụ phản hồi minh họa những hiểu biết chính. Xác định những khoảng trống cần nghiên cứu thêm. Trình bày các phát hiện với sự thận trọng thích hợp về khả năng khái quát hóa.
Những sai lầm thường gặp khi thiết kế bảng câu hỏi (và cách tránh chúng)
- Câu hỏi gợi ý: "Bạn không nghĩ X quan trọng sao?" → "X quan trọng với bạn như thế nào?"
- Kiến thức giả định: Định nghĩa các thuật ngữ kỹ thuật hoặc từ viết tắt—không phải ai cũng biết thuật ngữ chuyên ngành của bạn.
- Các tùy chọn phản hồi chồng chéo: "0-5 tuổi, 5-10 tuổi" gây nhầm lẫn. Hãy dùng "0-4 tuổi, 5-9 tuổi".
- Ngôn ngữ đã tải: "Sản phẩm sáng tạo của chúng tôi" có thể gây ra sự thiên vị. Hãy giữ thái độ trung lập.
- Độ dài quá mức: Mỗi phút thêm vào sẽ làm giảm tỷ lệ hoàn thành từ 3-5%. Tôn trọng thời gian của người trả lời.
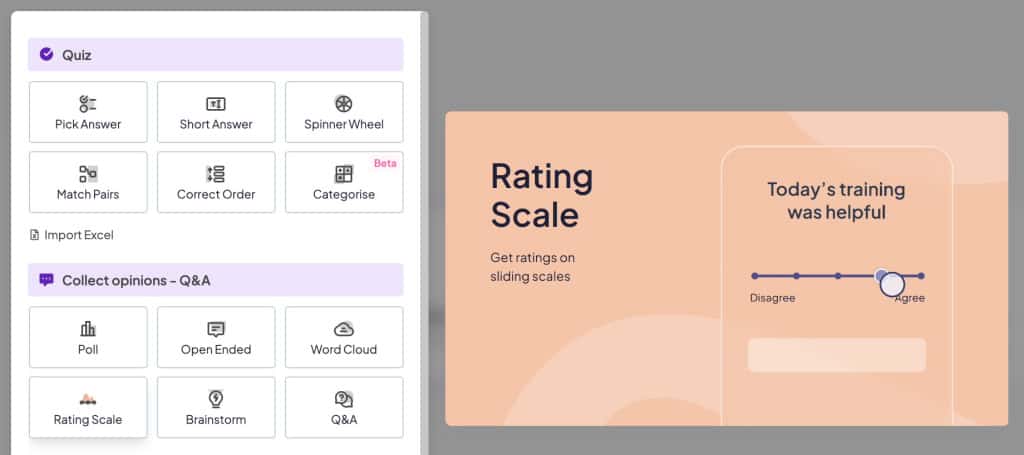
Cách tạo bảng câu hỏi trong AhaSlides
Dưới đây là 5 bước đơn giản để tạo một cuộc khảo sát hấp dẫn và nhanh chóng Sử dụng thang đo Likert. Bạn có thể sử dụng thang đo này cho các khảo sát về mức độ hài lòng của nhân viên/dịch vụ, khảo sát phát triển sản phẩm/tính năng, phản hồi của sinh viên và nhiều hơn nữa👇
Bước 1: Đăng ký AhaSlides miễn phí tài khoản.
Bước 2: Tạo bản trình bày mới hoặc đi đến 'Thư viện mẫu' và lấy một mẫu từ phần 'Khảo sát'.
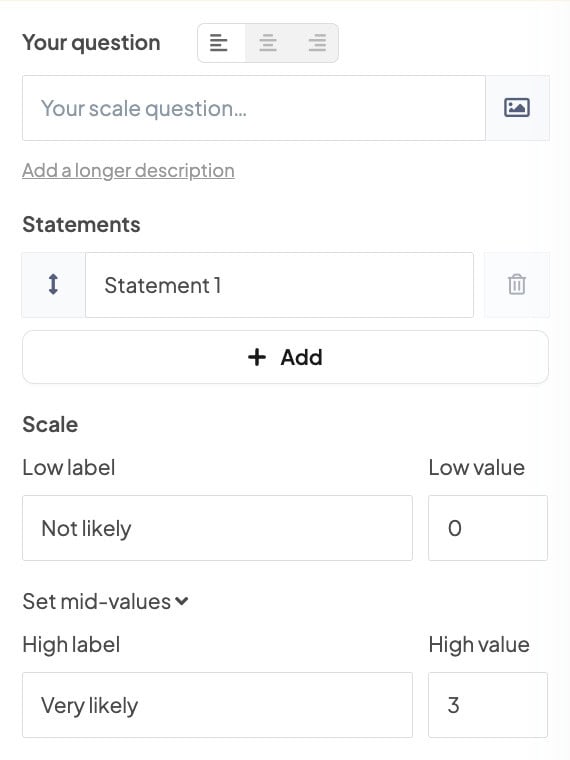
Bước 3: Trong bản trình bày của bạn, hãy chọn 'Cân' kiểu trượt.
Bước 4: Nhập từng câu để người tham gia đánh giá và đặt thang điểm từ 1-5.
Bước 5: Nếu bạn muốn họ Truy cập khảo sát của bạn ngay lập tức, nhấp vào 'Hiện tại' nút để họ có thể xem nó trên thiết bị của họ. Bạn cũng có thể vào 'Cài đặt' - 'Ai là người dẫn đầu' - và chọn 'Khán giả (tự nhịp độ)' tùy chọn để thu thập ý kiến bất cứ lúc nào.
💡 Mẹo: Bấm vào 'Kết quả' sẽ cho phép bạn xuất kết quả sang Excel/PDF/JPG.
FAQ
Năm bước trong việc thiết kế một bảng câu hỏi là gì?
Năm bước thiết kế bảng hỏi là #1 - Xác định mục tiêu nghiên cứu, #2 - Quyết định hình thức bảng câu hỏi, #3 - Xây dựng câu hỏi rõ ràng và ngắn gọn, #4 - Sắp xếp các câu hỏi một cách hợp lý và #5 - Thử nghiệm trước và sàng lọc bảng câu hỏi .
Có bao nhiêu loại bảng câu hỏi trong nghiên cứu?
Có 4 loại bảng hỏi trong nghiên cứu: Có cấu trúc - Không cấu trúc - Bán cấu trúc - Hỗn hợp.
5 câu hỏi khảo sát tốt là gì?
5 câu hỏi khảo sát hay - cái gì, ở đâu, khi nào, tại sao và như thế nào là cơ bản nhưng việc trả lời chúng trước khi bắt đầu khảo sát sẽ giúp mang lại kết quả tốt hơn.