
La maggior parte dei problemi relativi ai sondaggi si verifica prima ancora che qualcuno apra il link. L'obiettivo è vago, quindi le domande divagano in troppe direzioni. Le domande sono formulate male, quindi i dati risultano ambigui. Non c'è un piano di analisi, quindi i risultati rimangono in una dashboard che nessuno consulta più. Questa guida illustra l'intero processo: definire cosa si vuole apprendere, scegliere il tipo di sondaggio più adatto, formulare domande efficaci, distribuire il sondaggio in modo efficiente, migliorare i tassi di risposta e trasformare i dati in decisioni. Ogni sezione rimanda a una guida più approfondita sull'argomento.
Che cos'è un sondaggio online?
Un sondaggio online è un insieme strutturato di domande presentate in formato digitale e compilate dai partecipanti sul proprio dispositivo. Può essere distribuito come link autonomo, incorporato in una diapositiva di una presentazione o condiviso tramite codice QR. Le risposte vengono raccolte e visualizzate in una dashboard, in genere in tempo reale.
A differenza dei sondaggi dal vivo, in cui i partecipanti rispondono a una singola domanda durante una sessione, un questionario raccoglie feedback strutturati attraverso diverse domande. Può essere eseguito in modo sincrono (durante una riunione, una formazione o un evento) o asincrono (i partecipanti lo completano quando preferiscono tramite un link).
Nel 2023, il mercato globale dei software per sondaggi online valeva 3.6 miliardi di dollari, e oltre il 78% delle aziende utilizzava strumenti di sondaggio per raccogliere feedback dai dipendenti e condurre ricerche di mercato. Gli strumenti si sono evoluti al passo con i flussi di lavoro. La sfida ora è utilizzarli in modo efficace.
Tipologie di sondaggi online e quando utilizzare ciascuna
La progettazione di un sondaggio varia notevolmente a seconda dello scopo. Utilizzare lo stesso modello per ogni caso d'uso è uno degli errori più comuni. Ecco quando ogni tipologia è la scelta giusta.
Indagini sulla soddisfazione dei dipendenti
Questi strumenti misurano la percezione che i dipendenti hanno del proprio lavoro, del team, del responsabile, della retribuzione e delle condizioni di lavoro. Combinano scale di valutazione con un piccolo numero di domande aperte di approfondimento e funzionano al meglio se somministrati trimestralmente o annualmente per monitorare le tendenze nel tempo. Vedi: Sondaggi sulla soddisfazione dei dipendenti: tipologie, domande e modelli gratuiti.
Sondaggi sul coinvolgimento dei dipendenti
I sondaggi sul coinvolgimento vanno oltre la semplice soddisfazione, misurando l'impegno discrezionale e il legame con gli obiettivi organizzativi. Richiedono un'attenta progettazione delle domande per evitare un linguaggio tendenzioso e una solida struttura di riservatezza per ottenere risposte sincere. Vedi: Come creare il miglior sondaggio sul coinvolgimento dei dipendenti (60 esempi di domande).
Sondaggi post-evento e post-formazione
Il tipo di sondaggio più comune nei contesti di formazione e sviluppo e negli eventi. Da somministrare durante o immediatamente dopo una sessione per ottenere i tassi di completamento più elevati e una maggiore accuratezza nel ricordo. I sondaggi post-evento si concentrano sull'esperienza e sulla logistica; le valutazioni della formazione si concentrano sul trasferimento e sull'applicazione dell'apprendimento. Vedi: Oltre 30 domande del sondaggio post-evento che forniscono un feedback concreto e utilizzabile..
Sondaggi Net Promoter Score (NPS).
L'NPS misura la fedeltà e la propensione a raccomandare un marchio utilizzando un'unica domanda con punteggio ("Quanto è probabile che ci raccomandi?") e domande di approfondimento facoltative. Produce un'unica metrica comparabile da monitorare nel tempo, risultando utile per il monitoraggio di clienti e partecipanti attraverso diverse coorti. Vedi: Oltre 20 domande efficaci per i sondaggi NPS con esempi..
Questionari sulla soddisfazione lavorativa
Specificamente focalizzato su ruolo, carico di lavoro e soddisfazione delle condizioni di lavoro, spesso utilizzato nelle valutazioni delle risorse umane o quando si indaga sul rischio di turnover. Più breve e mirato rispetto a un sondaggio completo sul coinvolgimento. Vedi: Questionario sulla soddisfazione lavorativa: 46 domande di esempio per le risorse umane e la formazione e sviluppo.
Indagini di valutazione della leadership
Utilizzato per raccogliere feedback a 360 gradi su manager e dirigenti senior. Richiede una solida progettazione dell'anonimato, un'attenta formulazione delle domande per evitare un linguaggio suggestivo e un piano su come i risultati verranno comunicati al soggetto. Vedi: 26 domande per un'indagine sulla leadership efficace.
Passaggio 1: Definisci il tuo obiettivo prima di scrivere una singola domanda
L'errore più comune nei sondaggi è quello di aprire uno strumento prima di aver definito un obiettivo. Prima di scrivere qualsiasi domanda, rispondi a queste tre domande:
Una valutazione della formazione volta a "capire se i partecipanti sono in grado di applicare i contenuti sul lavoro" pone domande molto diverse rispetto a una volta a "verificare se i partecipanti hanno gradito la sessione". Entrambi sono obiettivi legittimi. Confonderli, tuttavia, produce un sondaggio che non risponde in modo chiaro a nessuno dei due quesiti.
Passaggio 2: Scegliere le tipologie di domande corrette
Le tipologie di domande nei sondaggi non sono intercambiabili. Ognuna raccoglie un tipo di dato diverso e scegliere quella sbagliata per il proprio obiettivo è un problema strutturale che non può essere risolto in fase di analisi.
Scelta multipla È pensato per domande a risposta chiusa con un insieme definito di risposte: reparto, ruolo, sessione frequentata, sì o no. Produce conteggi precisi che si filtrano facilmente.
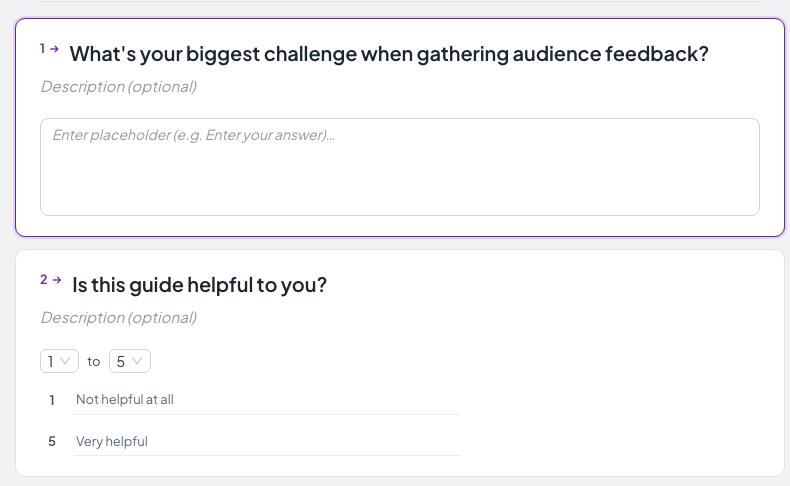
Scale di valutazione Sono il formato giusto per i dati relativi ad atteggiamenti e soddisfazione. Una scala a 5 punti funziona nella maggior parte dei contesti professionali. Utilizza una scala a 7 punti quando devi rilevare differenze più sottili tra i gruppi o monitorare piccoli cambiamenti nel tempo.
Elementi della scala Likert Si tratta di un formato di valutazione specifico che utilizza etichette di accordo (da "Fortemente d'accordo" a "Fortemente in disaccordo"). È il formato più comune nei sondaggi tra i dipendenti. Per indicazioni sulla selezione della scala ed esempi pronti all'uso, consultare: Oltre 40 esempi di scale Likert per sondaggi, formazione e feedback delle risorse umane.
Domande aperte Fornire risposte a testo libero. Utili per le domande di approfondimento ("Cosa cambieresti?") in cui si desidera un contesto qualitativo piuttosto che punteggi. Limitarsi a una o due per sondaggio. Le domande aperte aumentano significativamente i tempi di compilazione e i tassi di abbandono.
Domande sulla matrice Raggruppa gli elementi correlati in un'unica tabella, riducendo lo spazio occupato sullo schermo e consentendo un confronto diretto tra affermazioni simili.
Per una descrizione completa di ogni tipo di domanda, quando funziona e cosa produce, consultare: Tipologie di domande nei sondaggi: una guida pratica per un feedback migliore.
Fase 3: Scrivere domande che producano dati affidabili
La formulazione delle domande è la fonte più comune di dati inaffidabili nei sondaggi. Alcune semplici regole possono prevenire la maggior parte dei problemi.
Un'idea per ogni domanda. "Il facilitatore era competente e disponibile?" è una domanda che racchiude due aspetti in uno. Chi ha trovato il facilitatore competente ma non disponibile non ha una risposta valida. È meglio separarli.
Evitare un linguaggio tendenzioso. "Quanto ha migliorato le tue competenze la formazione?" presuppone un miglioramento. "Come valuteresti l'impatto di questa formazione sulle tue competenze?" non lo presuppone.
Scrivi a un livello di lettura comprensibile al pubblico più ampio possibile. Evitate gergo tecnico, acronimi e doppie negazioni. "La sessione ha soddisfatto le vostre aspettative?" è una tipologia di domanda che compare spesso nei sondaggi aziendali e che produce dati incomprensibili.
Tenerlo corto. Le ricerche sulla stanchezza da sondaggi mostrano costantemente che i tassi di completamento diminuiscono dopo circa 10 minuti di tempo di risposta. Cronometra il tuo sondaggio prima di distribuirlo.
Prima di pubblicare, effettuate un test pilota. Invia prima il sondaggio a due colleghi. Loro individueranno le ambiguità e le incongruenze logiche che tu non noterai dopo aver fissato la bozza per un'ora.
Per una raccolta di domande pronte all'uso in contesti di risorse umane, formazione e feedback dei clienti, consultare: Oltre 65 esempi di domande efficaci per sondaggi su risorse umane, formazione e feedback dei clienti.Per domande pensate per aumentare la partecipazione e ottenere risposte sincere nei sondaggi di gruppo, consultare: Oltre 100 domande divertenti per sondaggi sul coinvolgimento sul posto di lavoro.
Passaggio 4: Configura il tuo sondaggio in AhaSlides
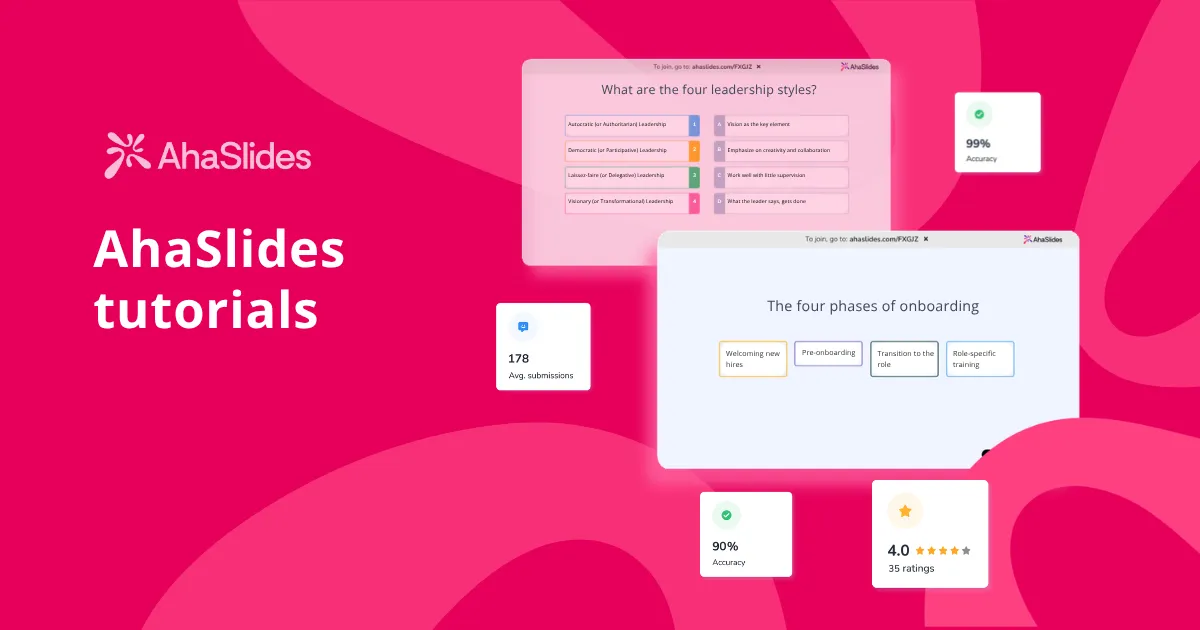
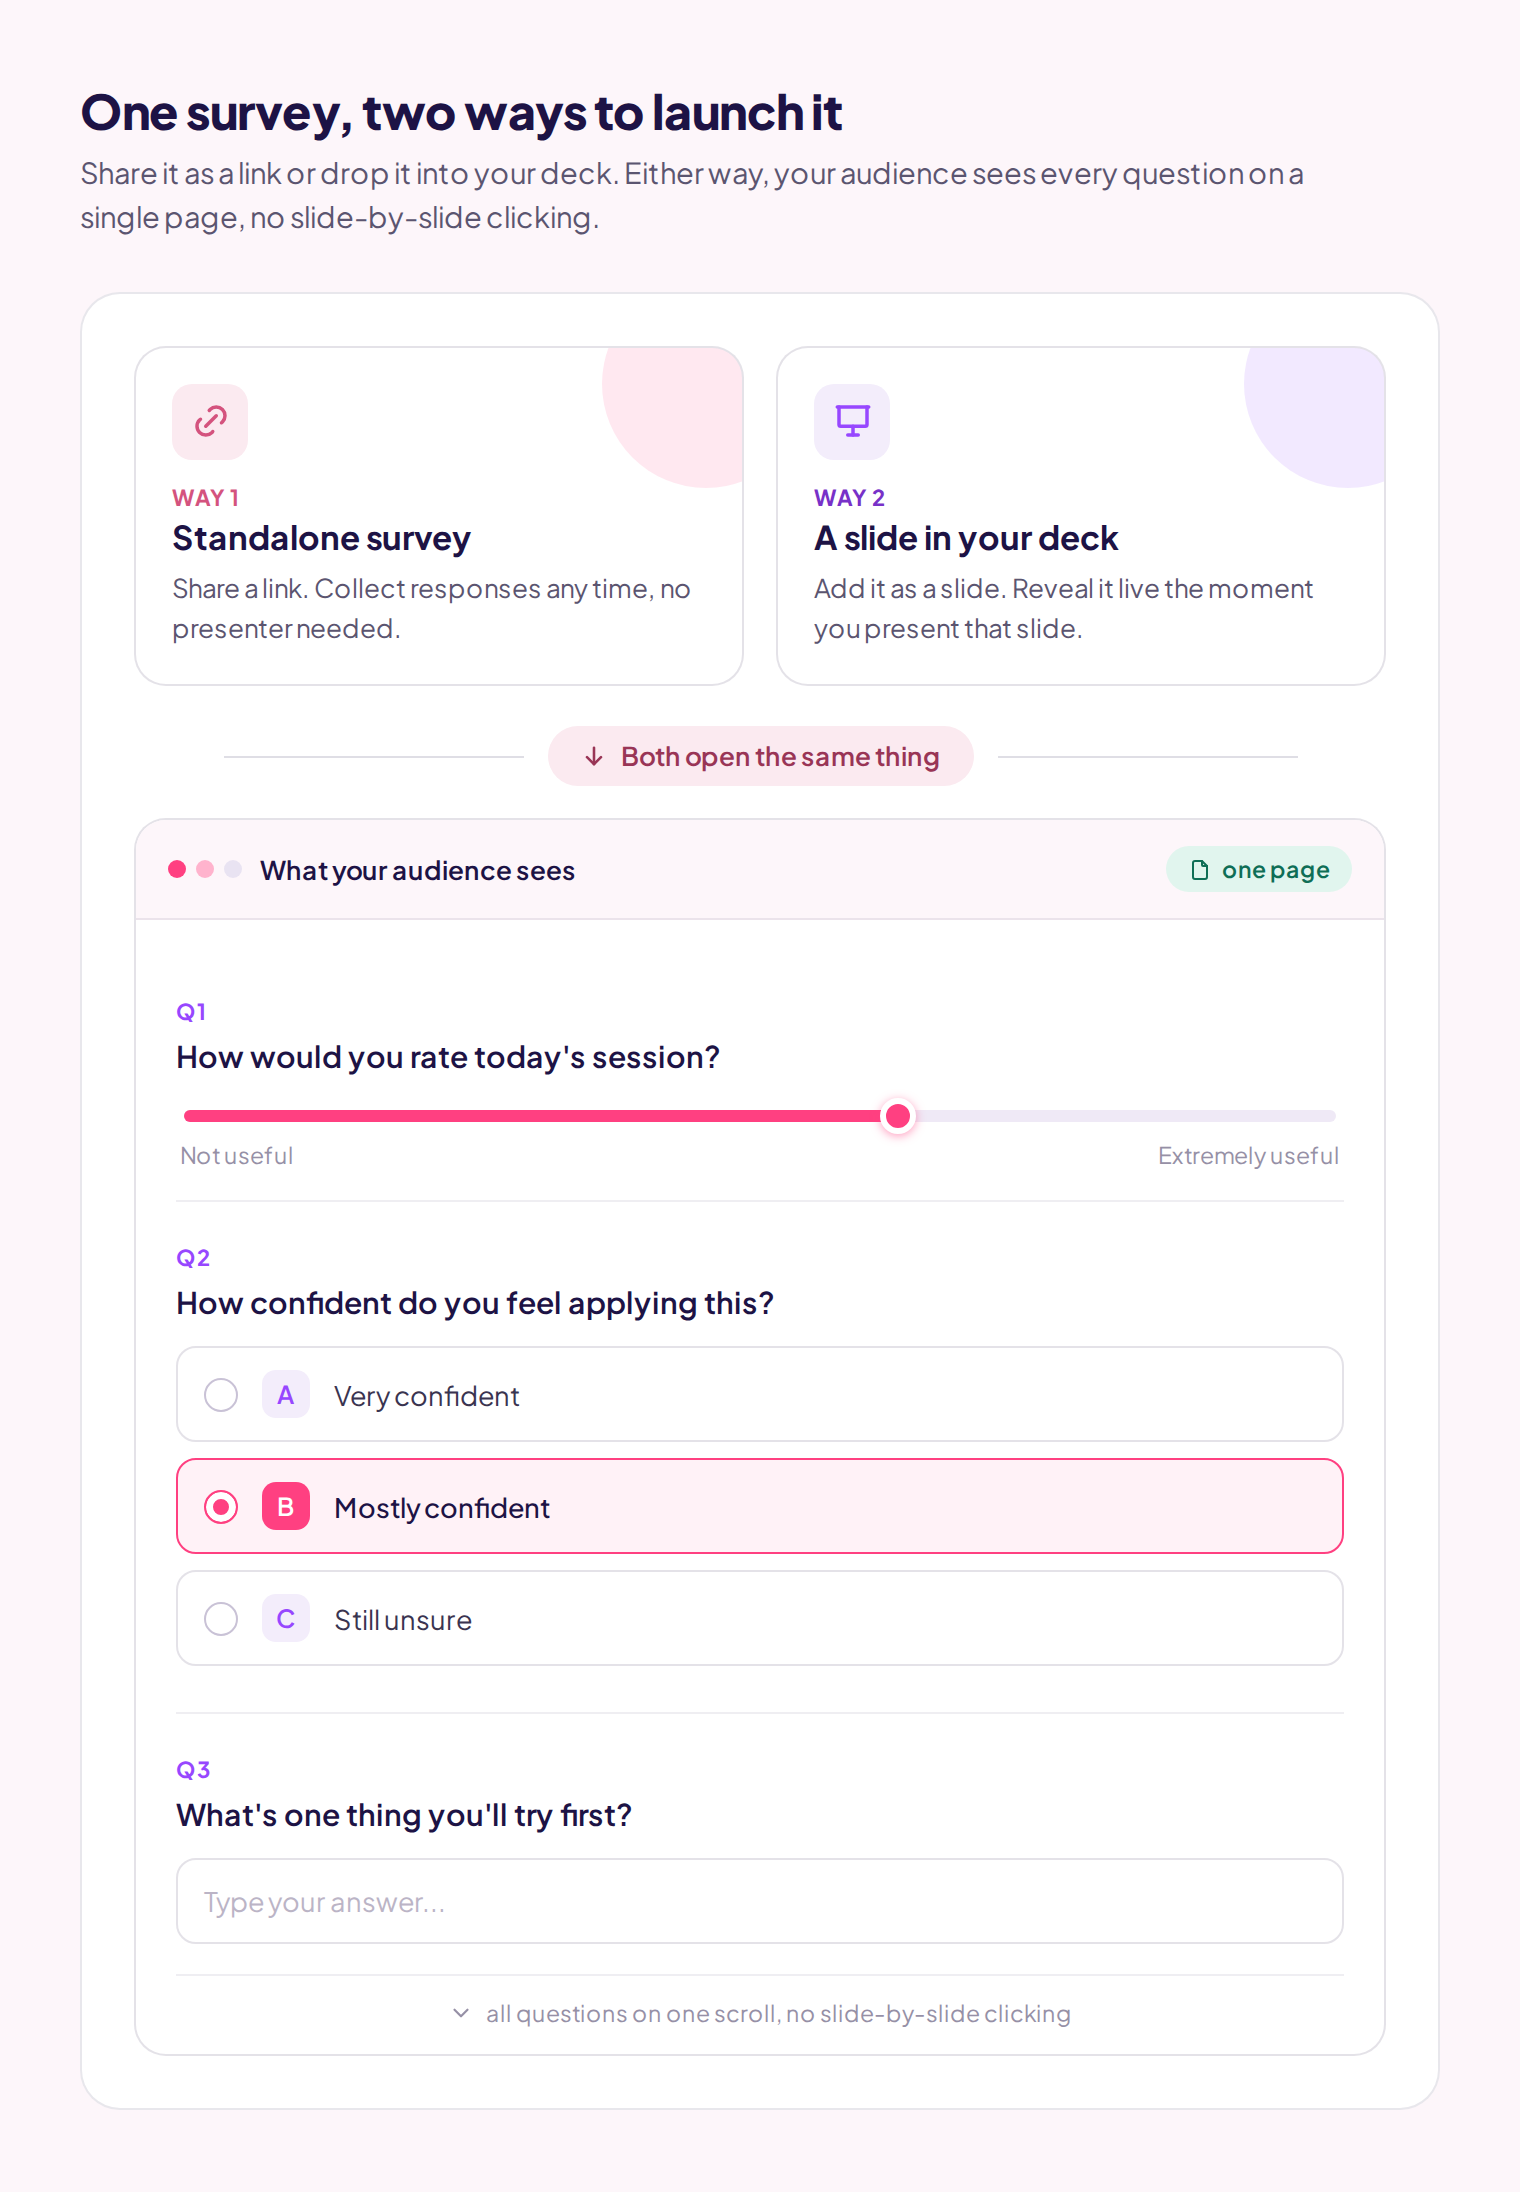
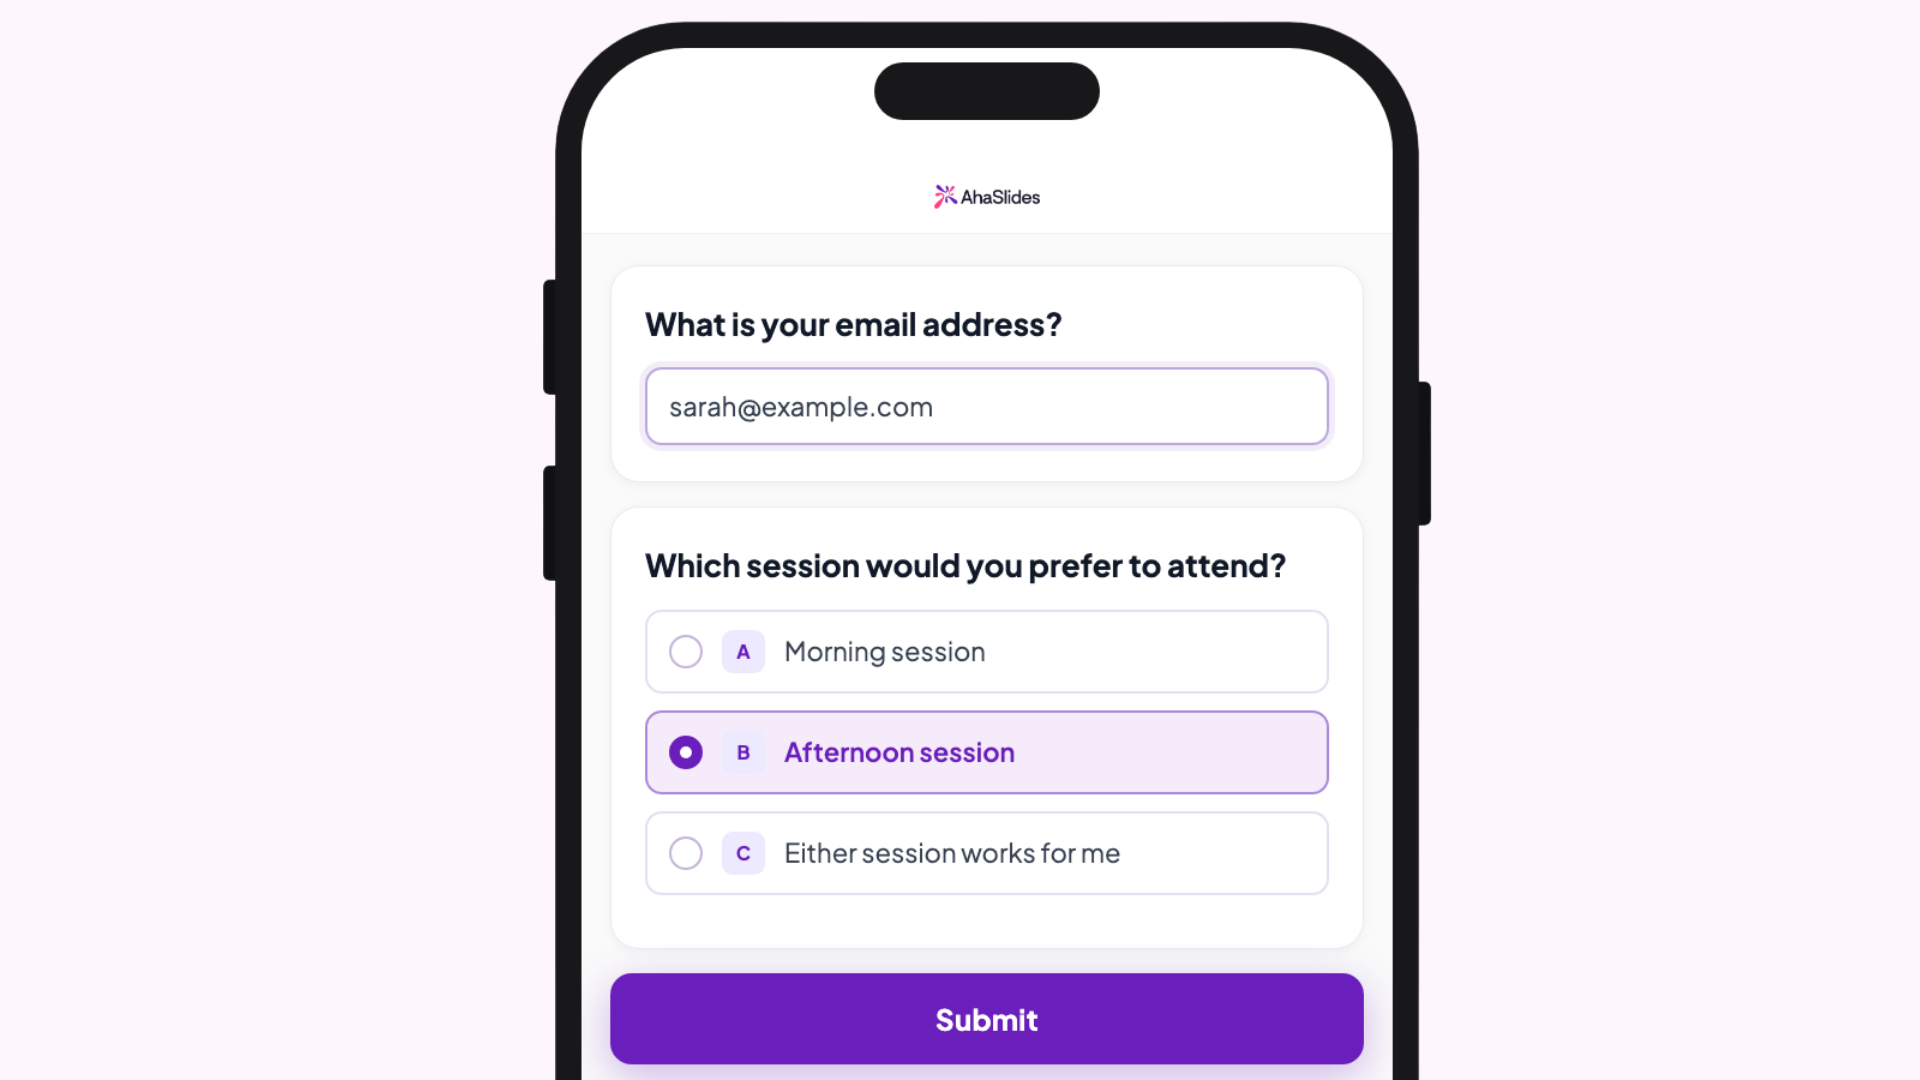
Vai Dashboard di AhaSlides e crea un account gratuito. Dalla dashboard, seleziona "Sondaggio". AhaSlides Survey supporta domande a risposta multipla, scale di valutazione, domande aperte e a matrice in un unico modulo multi-domanda, condivisibile tramite link o codice QR, oppure incorporabile in una diapositiva di presentazione.
Migliori AhaSlides, creatore di sondaggi gratuito Gestisce sia casi d'uso in tempo reale che asincroni dalla stessa interfaccia, consentendo ai team di formazione e sviluppo di eseguire una valutazione della formazione integrata in una diapositiva della sessione e quindi di distribuire lo stesso sondaggio tramite un link ai partecipanti che hanno partecipato da remoto, senza dover ricostruire nulla.
Fase 5: Distribuire il questionario
AhaSlides genera un link condivisibile e un codice di accesso. Le due modalità di distribuzione sono adatte a contesti diversi:
In diretta (durante la sessione): Aggiungi una diapositiva con un sondaggio alla tua presentazione AhaSlides. Quando passi a quella diapositiva durante la sessione, i partecipanti visualizzeranno il sondaggio completo sui propri dispositivi. Questo garantisce tassi di risposta più elevati perché i partecipanti sono già coinvolti e nel contesto giusto, e non è richiesta alcuna azione successiva da parte loro.
Asincrono (tramite link): Condividi il link via email, Slack o tramite il tuo LMS. I partecipanti lo completano quando preferiscono. I tassi di risposta sono inferiori, ma questa modalità è necessaria per i pubblici che non è possibile raggiungere in modo sincrono, per i sondaggi post-evento inviati dopo che i partecipanti se ne sono andati e per le indagini che richiedono un periodo di raccolta dati più lungo.
Su AhaSlides è presente una funzione per Invio di un'e-mail per richiedere la partecipazione al sondaggio. Incolla gli indirizzi email dei destinatari selezionati e il sistema invierà un'email di follow-up chiedendo loro di compilare il sondaggio.
Come migliorare i tassi di risposta ai sondaggi
I sondaggi online registrano in media un tasso di completamento compreso tra il 33 e il 44%, rispetto al 56-75% dei sondaggi cartacei equivalenti. Per i sondaggi interni, in cui si ha il controllo del contesto, i tassi di completamento sono generalmente più elevati, ma richiedono comunque una gestione attiva.
Il fattore determinante è la tempistica. Inviate il sondaggio quando l'esperienza è ancora fresca e i partecipanti sono ancora coinvolti. Un questionario di valutazione della formazione somministrato negli ultimi 10 minuti della sessione ottiene risultati costantemente migliori rispetto a uno inviato via email 48 ore dopo.
Per i sondaggi asincroni, un singolo promemoria inviato 48 ore prima della scadenza migliora i tassi di completamento dal 10 al 20%. Più di un promemoria, invece, genera risentimento che si ripercuote sui sondaggi successivi.
Prima di distribuire il questionario, scrivi una breve introduzione di una o due frasi: lo scopo del sondaggio, la sua durata e se le risposte saranno anonime. I partecipanti che comprendono a cosa servono i dati raccolti forniranno risposte più ponderate.
Per una disamina completa delle tattiche per aumentare il tasso di risposta con benchmark reali, consultare: 6 modi per migliorare i tassi di risposta ai sondaggi (con parametri di riferimento reali).
Sondaggi anonimi vs. sondaggi con nominativi
Per domande sull'efficacia della gestione, sulla cultura aziendale, sulla retribuzione o su qualsiasi argomento in cui gli intervistati potrebbero temere di non essere identificati, la raccolta anonima di dati produce risposte significativamente più sincere. Uno studio del 2020 ha rilevato che i dipendenti erano due volte più propensi a segnalare problemi sul posto di lavoro quando le risposte erano anonime rispetto a quando venivano attribuite.
Per le valutazioni della formazione in cui è necessario collegare i risultati ai registri di completamento individuali, o quando il follow-up con partecipanti specifici fa parte del piano, le risposte nominative sono appropriate.
La regola più importante: se dici ai partecipanti che un sondaggio è anonimo, deve esserlo davvero. Tradire la fiducia su questo punto avrà ripercussioni su tutti i sondaggi successivi. Consulta la guida completa: Sondaggio anonimo: una guida per principianti al feedback onesto sul posto di lavoro.
Fase 6: Analizzare e presentare i risultati
AhaSlides mostra i risultati in tempo reale sotto forma di dashboard visiva. Per le sessioni live, è possibile condividere lo schermo e analizzare i risultati con i partecipanti mentre l'esperienza è ancora fresca, il che tende a generare discussioni più approfondite rispetto all'invio di un report in PDF due settimane dopo.
Per un'analisi più approfondita, esporta le risposte in Excel. Da lì puoi creare tabelle incrociate per reparto o ruolo, calcolare i punteggi medi tra i vari gruppi o elaborare i dati a testo libero con uno strumento di intelligenza artificiale per identificare temi ricorrenti in grandi insiemi di risposte.
Pianifica la fase di analisi prima di avviare il sondaggio, non dopo. Prima di distribuirlo, scrivi due o tre domande specifiche a cui vuoi che i dati rispondano. Una volta ottenuti i risultati, collega i risultati direttamente a tali domande. Questo mantiene l'analisi focalizzata e facilita la comunicazione dei risultati in un linguaggio semplice, anziché inviare un file grezzo che la maggior parte delle persone non aprirà.
Per indicazioni su come strutturare i risultati in presentazioni che stimolino effettivamente all'azione, consultare: Presentazione dei risultati del sondaggio: come condividere risultati che vengano effettivamente utilizzati.
Modelli di sondaggio da cui partire
Se stai creando un sondaggio da zero, partire da un modello elimina il problema della pagina bianca e ti offre una struttura da modificare anziché da inventare. I modelli predefiniti coprono i casi d'uso più comuni: feedback post-evento, valutazioni della formazione, sondaggi tra i dipendenti e soddisfazione del cliente.
I modelli servono anche come verifica di calibrazione: se la bozza appare significativamente diversa da un modello ben progettato per lo stesso caso d'uso, di solito è un segnale che qualcosa non va a livello strutturale. Vedi: Modelli ed esempi di sondaggi: 4 opzioni gratuite e personalizzabili.
Scegliere lo strumento di indagine più adatto
Per i team che organizzano corsi di formazione e riunioni dal vivo, uno strumento che integra i sondaggi direttamente nelle presentazioni, consentendo ai partecipanti di rispondere in tempo reale anziché dover cercare un link in un secondo momento, offre in genere risultati migliori rispetto alle piattaforme di sondaggio indipendenti in termini di tassi di risposta e completezza dei dati.
Per un pubblico esterno numeroso, per ricerche di mercato o sondaggi che richiedono una logica di ramificazione complessa, piattaforme dedicate come SurveyMonkey, Typeform o Google Forms offrono maggiore flessibilità. La scelta giusta dipende dal caso d'uso principale, dal flusso di lavoro del team e dalla presenza o meno di un moderatore in tempo reale.
Per un confronto completo delle migliori opzioni gratuite con un'analisi onesta dei compromessi, consultare: I 10 migliori strumenti gratuiti per sondaggi aziendali: analisi e confronto dettagliati.
Consigli pratici per ottenere dati migliori
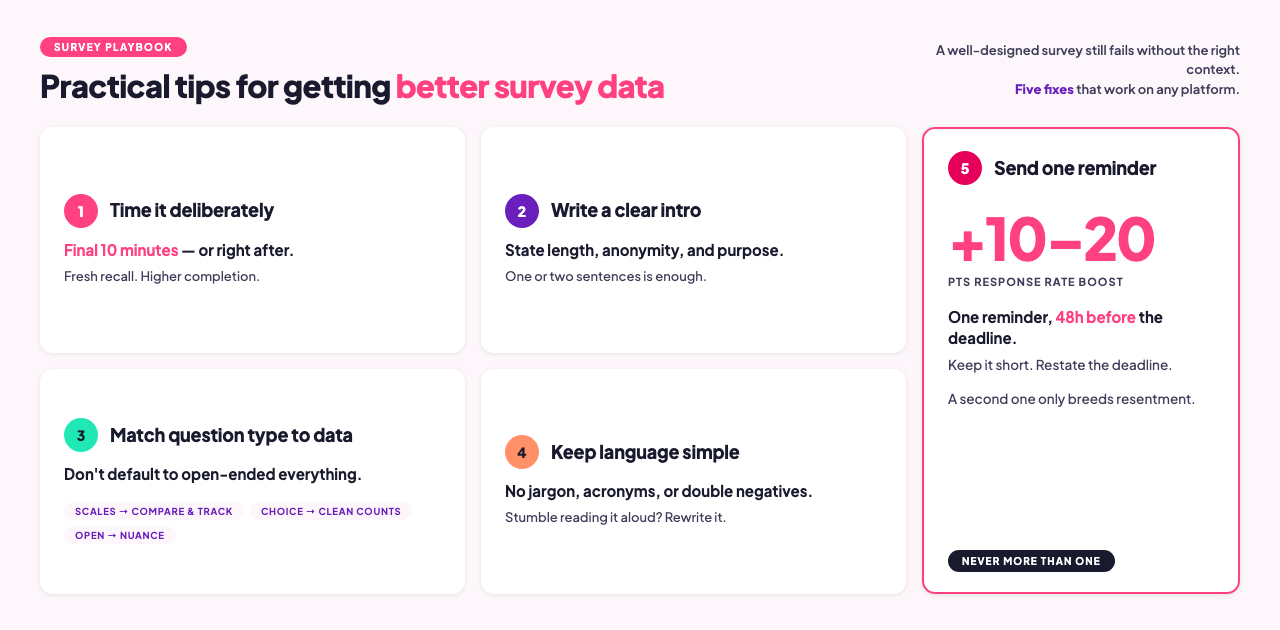
Abbina il tipo di domanda ai dati di cui hai bisogno. Le scale di valutazione sono utili per confrontare gruppi diversi e monitorare i cambiamenti nel tempo. Le domande aperte mettono in luce il contesto e le sfumature. Le domande a risposta multipla forniscono dati precisi. Un errore comune è quello di utilizzare domande aperte per ogni tipo di indagine, perché danno un senso di completezza, mentre una scala di valutazione produce dati più comparabili e utilizzabili all'interno di una coorte.
Utilizza un linguaggio semplice. Formulate le domande in un linguaggio comprensibile alla più ampia gamma possibile di intervistati. Leggete ogni domanda ad alta voce prima di pubblicarla. Se vi fermate o inciampate, riscrivetela.
Chiudere il cerchio. Se le persone compilano un sondaggio e non vengono mai informate su come sono stati utilizzati i risultati, il tasso di risposta al sondaggio successivo cala. Anche un riassunto di un solo paragrafo, "ecco cosa abbiamo scoperto, ecco cosa stiamo cambiando", contribuisce a mantenere la fiducia che rende i sondaggi futuri efficaci.
Non bisogna considerare tutti i tipi di sondaggio come identici. Le tipologie di domande, la lunghezza, le tempistiche e i requisiti di anonimato differiscono significativamente tra una valutazione post-formazione, un sondaggio sul coinvolgimento dei dipendenti e una misurazione NPS. Ciascuna ha una propria logica di progettazione.
Errori comuni da correggere prima del lancio
Saltare un episodio pilota. Invia il questionario a uno o due colleghi prima di distribuirlo a tutti. In questo modo potranno individuare formulazioni ambigue, link non funzionanti e domande che producono dati inutilizzabili, errori che tu, dopo aver riletto la bozza, non avresti notato.
Troppe domande aperte. Una o due domande aperte sono utili. Sei sono un peso. La maggior parte dei partecipanti abbandonerà un sondaggio che sembra un esame scritto.
Nessun piano di analisi. Se non si prevede cosa succederà una volta ottenuti i risultati, i dati rimarranno inutilizzati. È fondamentale integrare la fase di analisi nel flusso di lavoro prima di avviare il sondaggio.
Strumento inadatto a questo caso d'uso. Uno strumento ottimizzato per la ricerca sui clienti non è lo stesso di uno ottimizzato per la valutazione della formazione in tempo reale. Per una spiegazione dettagliata, consulta il confronto tra gli strumenti: I 10 migliori strumenti gratuiti per sondaggi aziendali.
Domande frequenti
Quante domande dovrebbe contenere un sondaggio online?
Per le sessioni live in cui i partecipanti rispondono in tempo reale, puntate a 5-8 domande. In genere, ciò richiede dai 3 ai 5 minuti e mantiene il tasso di completamento vicino al 100% quando i partecipanti sono già coinvolti nel contesto. Per i sondaggi asincroni inviati tramite link, 10-12 domande rappresentano un limite ragionevole. Cronometrate il vostro sondaggio prima di distribuirlo; i tassi di completamento diminuiscono dopo circa 10 minuti di tempo di risposta.
I sondaggi dovrebbero essere anonimi?
Dipende dall'argomento. Le domande sull'efficacia del management, sulla cultura aziendale e sulla retribuzione traggono vantaggio dall'anonimato e producono dati più veritieri. Le valutazioni della formazione, dove è necessario il completamento individuale di ogni sondaggio, non ne beneficiano. La chiave è la trasparenza: se si comunica ai partecipanti che un sondaggio è anonimo, deve esserlo anche tecnicamente. Consulta la guida completa: Sondaggio anonimo: una guida per principianti al feedback onesto sul posto di lavoro.
Cosa devo fare con le risposte a testo libero?
Iniziate leggendo un campione di 15-20 risposte per comprendere la gamma di risposte. Quindi raggruppate le risposte in temi manualmente o utilizzate uno strumento di intelligenza artificiale per etichettare le idee ricorrenti. Per set di dati con meno di 50 risposte, la codifica manuale è in genere più veloce e precisa. Per set più grandi, strumenti come ChatGPT o Claude possono riassumere i temi dal testo incollato in pochi secondi. In entrambi i casi, contestualizzate i risultati dell'analisi del testo libero con dati quantitativi: "Il 40% delle risposte libere menzionava il ritmo" è un'affermazione più utile di un elenco di citazioni.
Qual è il miglior strumento di indagine per i team delle Risorse Umane e della Formazione e Sviluppo?
Per i team che organizzano sessioni di formazione dal vivo e necessitano di integrare sondaggi nelle presentazioni, AhaSlides combina la raccolta dei dati con la presentazione stessa, consentendo ai partecipanti di rispondere in tempo reale anziché tramite un'e-mail di follow-up. Per sondaggi asincroni autonomi o sondaggi di coinvolgimento a livello aziendale, le piattaforme HR dedicate offrono funzionalità di analisi più approfondite. Vedi: I 10 migliori strumenti gratuiti per sondaggi aziendali.
Qual è la differenza tra un sondaggio e un'indagine?
Un sondaggio è una singola domanda, in genere utilizzata per ottenere rapidamente un riscontro dal pubblico durante una riunione o una presentazione dal vivo. Un'indagine, invece, è uno strumento strutturato con più domande, progettato per raccogliere dati in modo sistematico su un argomento. I sondaggi sono più adatti per il coinvolgimento in tempo reale e per il processo decisionale in presenza. Le indagini sono più indicate per la ricerca, la valutazione e la raccolta di feedback, quando sono necessari dati su cui agire in seguito.
Posso utilizzare lo stesso sondaggio sia per un pubblico in tempo reale che per un pubblico asincrono?
Sì. In AhaSlides, un sondaggio può essere incorporato in una diapositiva di una presentazione per le sessioni dal vivo e distribuito come link autonomo per i partecipanti da remoto o che non hanno potuto partecipare di persona. Entrambi i set di risposte confluiscono nella stessa dashboard, quindi i risultati vengono combinati automaticamente senza bisogno di alcuna unione manuale.
Realizza il tuo primo sondaggio con AhaSlides
AhaSlides è adatto sia per sondaggi interattivi dal vivo integrati nelle presentazioni, sia per sondaggi asincroni distribuiti tramite link. Scale di valutazione, domande a risposta multipla, a matrice e a risposta aperta sono disponibili con un account gratuito. I risultati vengono visualizzati in tempo reale man mano che i partecipanti rispondono ed è possibile esportarli in Excel per un'analisi più approfondita.
Prova gratuitamente il creatore di sondaggi AhaSlides e avviare il tuo primo sondaggio in meno di cinque minuti.
fonti
[1] Nulty, DD (2008). "L'adeguatezza dei tassi di risposta ai sondaggi online e cartacei." Valutazione e accertamento nell'istruzione superiore. Università dell'Alaska Fairbanks PDF — una meta-analisi mostra che i sondaggi online hanno una media del 33% contro il 56% dei sondaggi cartacei equivalenti.
[2] Ricerca Grand View. Rapporto sulle dimensioni e le quote di mercato del software per sondaggi online, 2030. grandviewresearch.com — Dati relativi alle dimensioni del mercato e all'adozione da parte delle imprese.