
Most survey problems happen before anyone opens a link. The goal is vague, so the questions go in too many directions. The questions are poorly worded, so the data is ambiguous. There's no plan for analysis, so results sit in a dashboard nobody revisits. This guide covers the full process: defining what you want to learn, choosing the right survey type, writing good questions, distributing effectively, improving response rates, and turning data into decisions. Every section links to a deeper guide for that topic.
What is an online survey?
An online survey is a structured set of questions delivered digitally and completed by respondents on their own device. It can be distributed as a standalone link, embedded in a presentation slide, or shared via QR code. Responses are collected and displayed in a dashboard, typically in real time.
Unlike live polling, where participants answer a single question during a session, a survey captures structured feedback across multiple questions. It can run synchronously (during a meeting, training, or event) or asynchronously (participants complete it in their own time via link).
The global online survey software market was valued at $3.6 billion in 2023, with more than 78% of enterprises now using survey tools for employee feedback and market research. The tools have caught up with the workflow. The challenge is using them well.
Types of online surveys and when to use each
Survey design differs significantly depending on purpose. Using the same template for every use case is one of the most common mistakes. Here is when each type is the right choice.
Pesquisas de satisfação de funcionários
These measure how employees feel about their job, team, manager, compensation, and working conditions. They combine rating scales with a small number of open-ended follow-up questions, and work best run quarterly or annually to track trends over time. See: Pesquisas de satisfação de funcionários: tipos, perguntas e modelos gratuitos.
Pesquisas de engajamento de funcionários
Engagement surveys go deeper than satisfaction, measuring discretionary effort and connection to organizational purpose. They require careful question design to avoid leading language and need strong confidentiality design to produce honest responses. See: How to create the best employee engagement survey (60 question examples).
Post-event and training surveys
The most common survey type in L&D and events contexts. Run during or immediately after a session for the highest completion rates and most accurate recall. Post-event surveys focus on experience and logistics; training evaluations focus on learning transfer and application. See: Mais de 30 perguntas de pesquisa pós-evento que geram feedback acionável..
Pesquisas de Net Promoter Score (NPS)
NPS measures loyalty and advocacy using a single scored question ("How likely are you to recommend us?") plus optional follow-ups. It produces a single comparable metric to track over time, making it useful for customer and participant tracking across cohorts. See: 20+ best NPS survey questions with examples.
Job satisfaction questionnaires
Focused specifically on role, workload, and work condition satisfaction, often used in HR reviews or when investigating turnover risk. Shorter and more targeted than a full engagement survey. See: Questionário de satisfação no trabalho: 46 perguntas de exemplo para RH e T&D.
Leadership assessment surveys
Used to gather 360-degree feedback on managers and senior leaders. Require strong anonymity design, careful question framing to avoid leading language, and a plan for how results will be communicated back to the subject. See: 26 perguntas para uma avaliação eficaz da liderança..
Step 1: Define your objective before writing a single question
The most common survey mistake is opening a tool before defining a goal. Before writing any questions, answer these three things:
- What decision will this data inform? If you cannot name a specific decision, the survey has no clear purpose.
- Who needs to see the results? A line manager, HR leadership, a training vendor, or the participants themselves all need different formats and levels of detail.
- What would a useful result look like? Write out a hypothetical finding before collecting data. "If 60% of participants rate module three as 3 or below, we will revise it." That kind of hypothesis keeps the survey focused.
A training evaluation aimed at "understanding whether participants can apply content on the job" produces very different questions than one aimed at "checking whether people enjoyed the session." Both are legitimate goals. Conflating them produces a survey that answers neither clearly.
Step 2: Choose the right question types
Survey question types are not interchangeable. Each collects a different kind of data, and choosing the wrong one for your goal is a structural problem that cannot be fixed in analysis.
Múltipla escolha is for close-ended questions with a defined answer set: department, role, session attended, yes or no. It produces clean counts that filter easily.
Escalas de classificação are the right format for attitude and satisfaction data. A 5-point scale works for most professional contexts. Use a 7-point scale when you need to detect finer differences between groups or track small changes over time.
Likert-scale items are a specific rating format using agreement labels (Strongly agree to Strongly disagree). They are the most common format in employee surveys. For scale selection guidance and ready-to-use examples, see: Mais de 40 exemplos de escala Likert para pesquisas, treinamentos e feedback de RH..
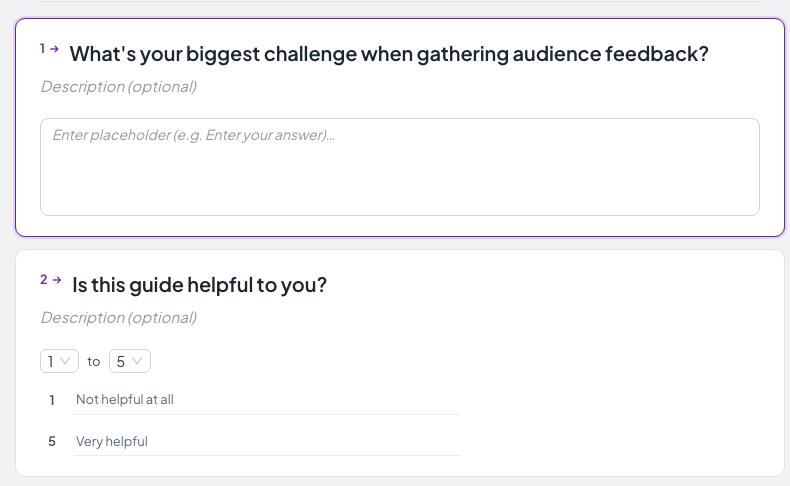
Questões em aberto produce free-text responses. Useful for follow-up questions ("What would you change?") where you want qualitative context rather than scores. Limit these to one or two per survey. Open-ended questions significantly increase completion time and abandonment rates.
Questões matriciais group related items into a single table, reducing screen space and allowing direct comparison across similar statements.
For a full breakdown of every question type, when each works, and what each produces, see: Tipos de perguntas em pesquisas: um guia prático para obter melhores resultados..
Step 3: Write questions that produce reliable data
Question wording is the most common source of unreliable survey data. A few rules prevent most problems.
One idea per question. "Was the facilitator knowledgeable and approachable?" is two questions in one. Respondents who found the facilitator knowledgeable but not approachable have no valid answer. Split them.
Evite linguagem tendenciosa. "How much did the training improve your skills?" assumes improvement. "How would you rate the impact of this training on your skills?" does not.
Write at the reading level of the widest audience. Avoid jargon, acronyms, and double negatives. "Did the session not fail to meet your expectations?" is a real question type that appears in corporate surveys and produces data nobody can interpret.
Mantenha curto. Research on survey fatigue consistently shows completion rates drop after about 10 minutes of response time. Time your own survey before distributing it.
Pilot before you publish. Send the survey to two colleagues first. They will catch ambiguous wording and broken logic that you will not notice after staring at the draft for an hour.
For a bank of ready-to-use questions across HR, training, and customer feedback contexts, see: Mais de 65 exemplos eficazes de perguntas para pesquisas de RH, treinamento e feedback de clientes.. For questions designed to increase participation and honest responses across team surveys, see: Mais de 100 perguntas divertidas para pesquisas sobre engajamento no ambiente de trabalho.
Step 4: Set up your survey in AhaSlides
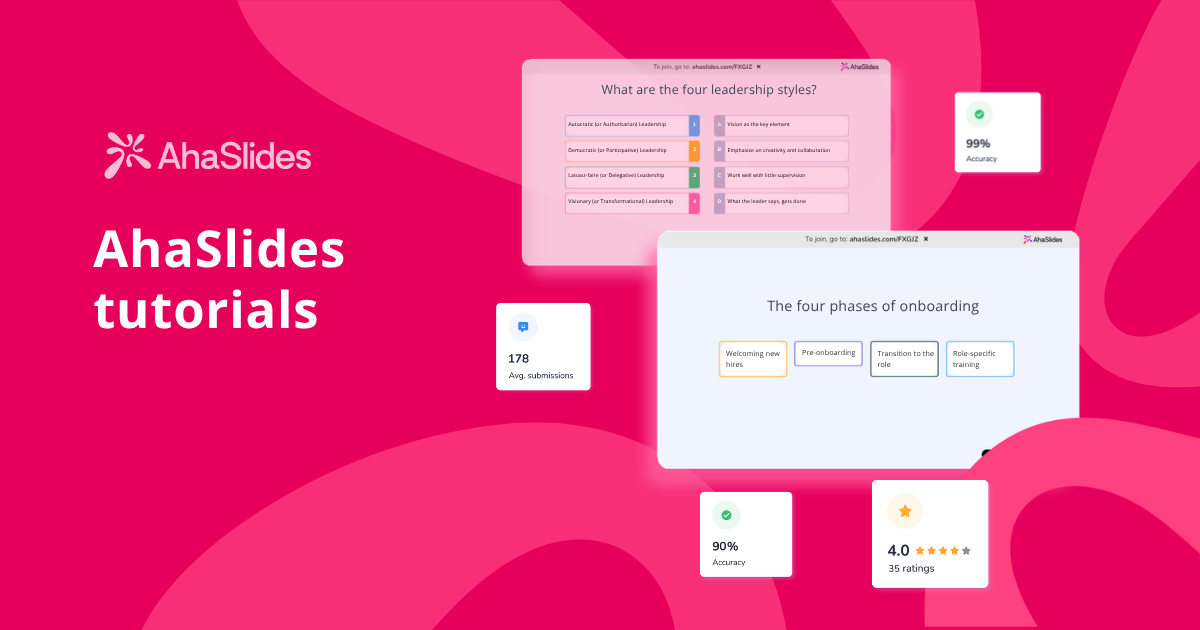
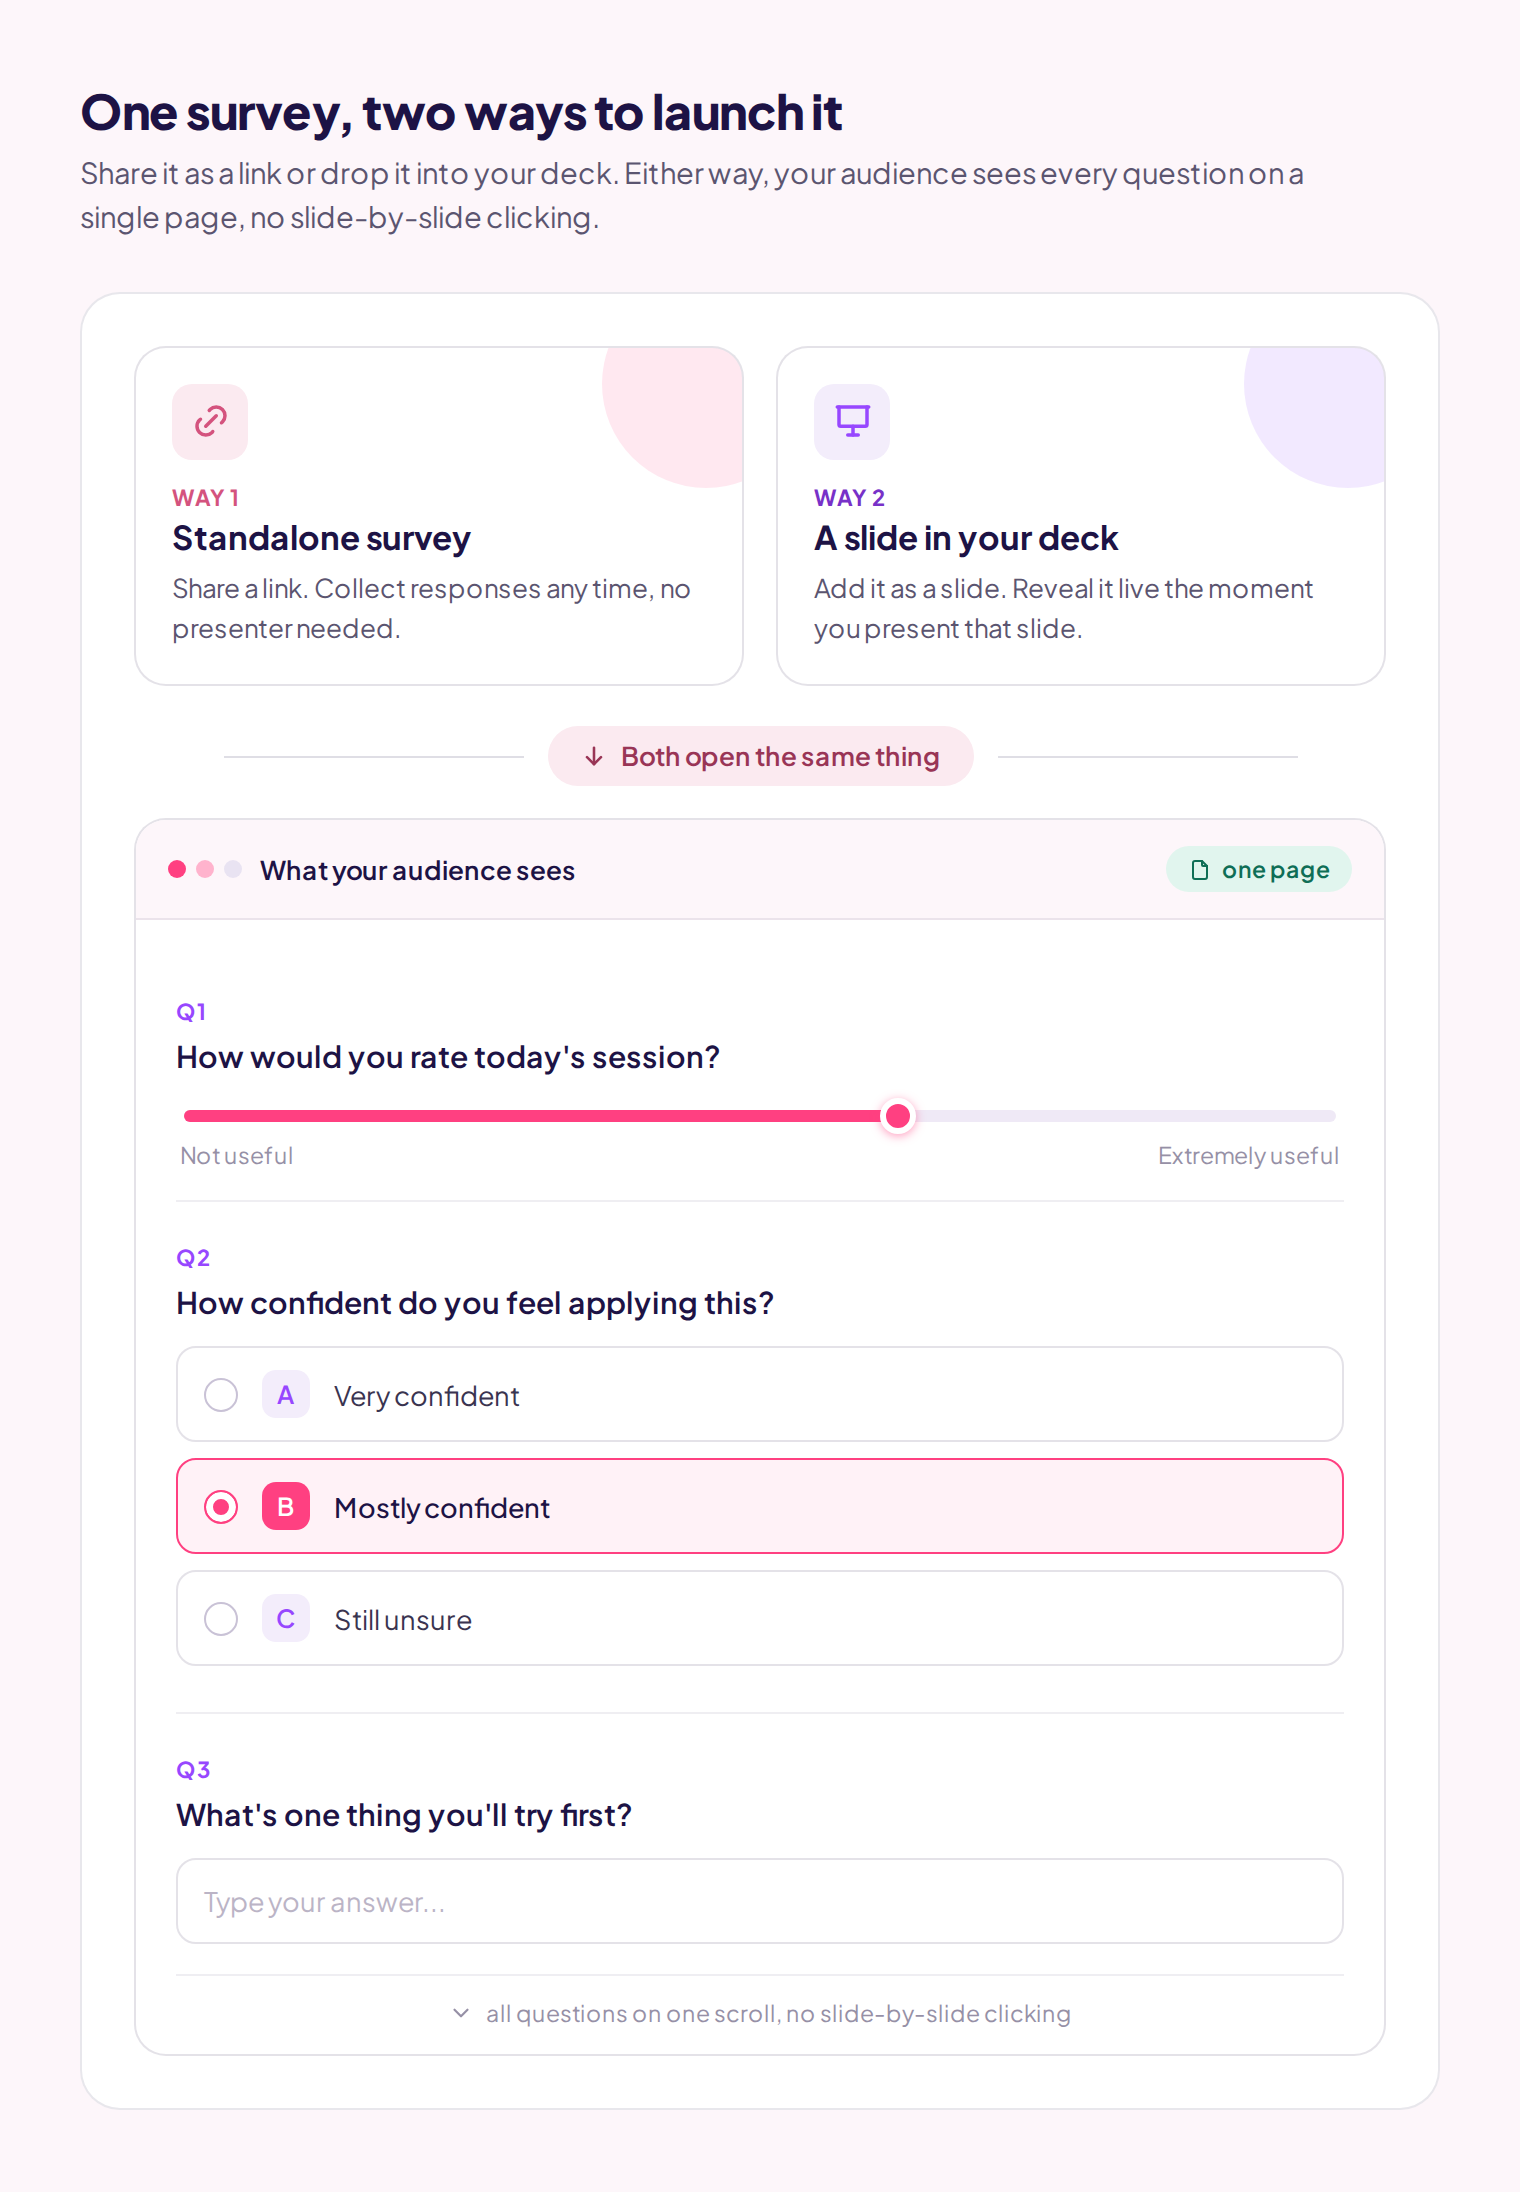
Vou ao AhaSlides dashboard and create a free account. From the dashboard, select 'Survey'. AhaSlides Survey supports multiple choice, rating scales, open-ended, and matrix questions in a single multi-question form, shareable by link or QR code, or embeddable in a presentation slide.
As Criador de pesquisas gratuito AhaSlides handles both live and async use cases from the same interface, so L&D teams can run a training evaluation embedded in a session slide and then distribute the same survey as a link to participants who attended remotely, without rebuilding anything.
Etapa 5: Distribua o questionário
AhaSlides generates a shareable link and a join code. Two distribution modes serve different contexts:
Live (in-session): Add a Survey slide to your AhaSlides presentation. When you advance to that slide during the session, participants see the full survey on their own devices. This produces the highest response rates because participants are already engaged and in context, and there is no follow-up action required from them.
Async (by link): Share the link via email, Slack, or your LMS. Participants complete it in their own time. Response rates are lower, but this mode is necessary for audiences you cannot gather synchronously, post-event surveys sent after attendees leave, and pulse checks that need a longer collection window.
How to improve survey response rates
Online surveys average 33 to 44% completion compared to 56 to 75% for paper-based equivalents. For internal surveys where you control the context, rates are typically higher, but they still require active management.
The biggest single lever is timing. Send the survey when the experience is fresh and participants are still engaged. A training evaluation run in the final 10 minutes of the session consistently outperforms one sent by email 48 hours later.
For async surveys, a single follow-up reminder sent 48 hours before the deadline improves completion rates by 10 to 20 percentage points. More than one reminder creates resentment that carries forward to future surveys.
Before distributing, write a one- or two-sentence introduction: the survey's purpose, how long it takes, and whether responses are anonymous. Participants who understand what the data is for give more thoughtful answers.
For a full breakdown of response rate tactics with real benchmarks, see: 6 maneiras de melhorar as taxas de resposta em pesquisas (com parâmetros reais).
Anonymous vs. named surveys
For questions about management effectiveness, workplace culture, compensation, or anything where respondents might worry about identification, anonymous collection produces significantly more honest responses. A 2020 study found that employees were twice as likely to report workplace issues when responses were anonymous versus attributed.
For training evaluations where you need to tie results to individual completion records, or when follow-up with specific participants is part of the plan, named responses are appropriate.
The most important rule: if you tell participants a survey is anonymous, it needs to be technically anonymous. Trust broken on that point affects every survey you run afterward. See the full guide: Pesquisa anônima: um guia para iniciantes sobre feedback honesto no ambiente de trabalho.
Step 6: Analyze and present results
AhaSlides shows results in real time as a visual dashboard. For live sessions, you can share the screen and walk through findings with participants while the experience is still fresh, which tends to produce richer discussion than sending a PDF report two weeks later.
For deeper analysis, export responses to Excel. From there you can cross-tabulate by department or role, calculate average scores across cohorts, or run open-text data through an AI tool to identify themes across large response sets.
Plan the analysis step before you run the survey, not after. Before distributing, write down two or three specific questions you want the data to answer. Once results arrive, map findings directly to those questions. This keeps analysis focused and makes it easier to communicate results in plain language rather than sending around a raw export most people will not open.
For guidance on structuring results into presentations that actually drive action, see: Apresentação dos resultados da pesquisa: como compartilhar descobertas que realmente sejam utilizadas..
Survey templates to start from
If you are building a survey from scratch, starting from a template removes the blank-page problem and gives you a structure to edit rather than invent. Pre-built templates cover the most common use cases: post-event feedback, training evaluations, employee pulse checks, and customer satisfaction.
Templates also serve as a calibration check: if your draft looks significantly different from a well-designed template for the same use case, that is usually a signal that something is off structurally. See: Modelos e exemplos de questionários: 4 opções gratuitas e personalizáveis.
Choosing the right survey tool
For teams that run live training and meetings, a tool that integrates surveys directly into presentations, so participants answer in the room rather than chasing a link later, typically outperforms standalone survey platforms on response rates and data completeness.
For large external audiences, customer research, or surveys requiring advanced branching logic, dedicated platforms like SurveyMonkey, Typeform, or Google Forms offer more flexibility. The right choice depends on your primary use case, team workflow, and whether live facilitation is part of the picture.
For a full comparison of the best free options with honest analysis of trade-offs, see: Top 10 free survey tools for businesses: detailed analysis and comparison.
Practical tips for better data
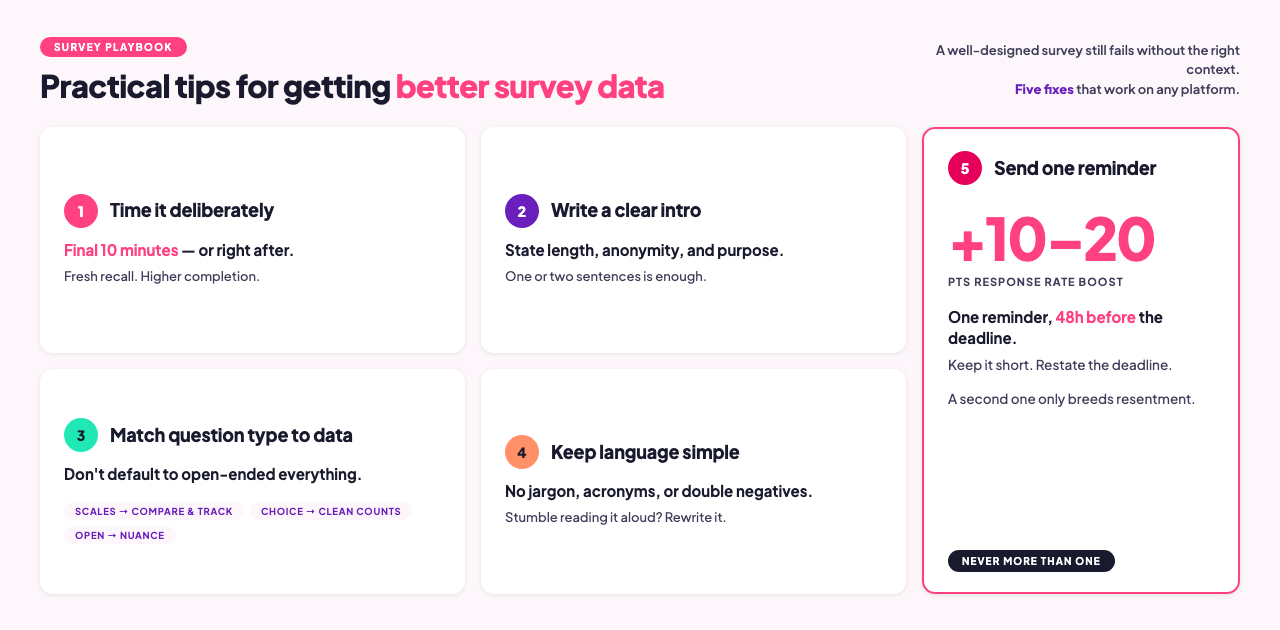
Associe o tipo de pergunta aos dados que você precisa. Rating scales are good for comparing across groups and tracking change over time. Open-ended questions surface context and nuance. Multiple choice gives you clean counts. A common mistake is using open-ended questions for everything because they feel thorough, when a rating scale produces more comparable, usable data across a cohort.
Mantenha a linguagem simples. Write questions at the reading level of the widest range of respondents. Read each question aloud before publishing. If you pause or stumble, rewrite it.
Feche o ciclo. If people complete a survey and never hear what happened with the results, response rates on the next survey drop. Even a one-paragraph summary, "here is what we heard, here is what we are changing," maintains the trust that makes future surveys viable.
Do not treat all survey types as identical. The question types, length, timing, and anonymity requirements differ significantly between a post-training evaluation, an employee engagement survey, and an NPS measurement. Each has its own design logic.
Erros comuns a corrigir antes do lançamento
Pulando o episódio piloto. Send the survey to one or two colleagues before full distribution. They will catch ambiguous wording, broken links, and questions that produce unusable data that you will not notice yourself after staring at the draft.
Muitas perguntas sem resposta definitiva. One or two open-ended questions is useful. Six is a burden. Most respondents will abandon a survey that reads like a written exam.
No analysis plan. If there is no plan for what happens when results arrive, the data sits unused. Build the analysis step into your workflow before you run the survey.
Wrong tool for the use case. A tool optimized for customer research is not the same as one optimized for live training evaluations. See the tools comparison for a breakdown: Top 10 free survey tools for businesses.
Perguntas frequentes
Quantas perguntas deve conter uma pesquisa online?
For live sessions where participants answer in real time, aim for 5 to 8 questions. That typically takes 3 to 5 minutes and keeps completion near 100% when participants are already engaged in context. For async surveys sent by link, 10 to 12 questions is a reasonable ceiling. Time your own survey before distributing it; completion rates drop after about 10 minutes of response time.
As pesquisas devem ser anônimas?
It depends on the topic. Questions about management effectiveness, culture, and compensation benefit from anonymity and produce more honest data. Training evaluations where you need individual completion records do not. The key is transparency: if you tell participants a survey is anonymous, it needs to be technically anonymous. See the full guide: Pesquisa anônima: um guia para iniciantes sobre feedback honesto no ambiente de trabalho.
O que devo fazer com as respostas em texto aberto?
Start by reading a sample of 15 to 20 responses to understand the range of answers. Then group responses into themes manually or use an AI tool to tag recurring ideas. For datasets under 50 responses, manual coding is typically faster and more accurate. For larger sets, tools like ChatGPT or Claude can summarize themes from pasted text in seconds. Either way, anchor open-text findings to quantitative context: "40% of open responses mentioned pacing" is more actionable than a wall of quotes.
What is the best survey tool for HR and L&D teams?
For teams who run live training sessions and need surveys embedded in presentations, AhaSlides combines survey collection with the presentation itself, so participants respond in the room rather than via a follow-up email. For standalone async surveys or organization-wide engagement surveys, dedicated HR platforms offer more analytics depth. See: Top 10 free survey tools for businesses.
How is a survey different from a poll?
A poll is a single question, typically used for quick audience input during a live meeting or presentation. A survey is a structured multi-question instrument designed to collect systematic data on a topic. Polls are better for real-time engagement and decision-making in the room. Surveys are better for research, evaluation, and feedback collection where you need data to act on later.
Can I use the same survey for live and async audiences?
Yes. In AhaSlides, a survey can be embedded in a presentation slide for live sessions and distributed as a standalone link for participants who are remote or could not attend. Both response sets flow into the same dashboard, so results are combined automatically without any manual merging.
Run your first survey with AhaSlides
AhaSlides works for both live facilitated surveys embedded in presentations and async surveys distributed by link. Rating scales, multiple choice, matrix, and open-ended questions are available from a free account. Results appear in real time as participants respond, and you can export to Excel for deeper analysis.
Try the AhaSlides survey creator free and run your first survey in under five minutes.
Fontes
[1] Nulty, DD (2008). "A adequação das taxas de resposta a pesquisas online e em papel". Avaliação e Mensuração no Ensino Superior. Universidade do Alasca Fairbanks PDF — meta-analysis showing online surveys average 33% vs. 56% for paper-based equivalents.
[2] Pesquisa Grand View. Relatório sobre o tamanho e a participação de mercado de softwares para pesquisas online, 2030. grandviewresearch. com — dados sobre o tamanho do mercado e a adoção pelas empresas.