
Bar Graphs
 13
13
![]() 5
5
T
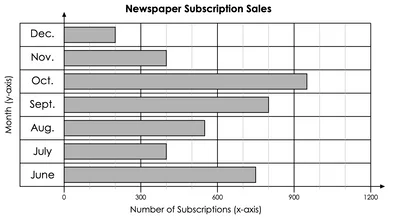
This presentation covers interpreting bar graphs, including wind days and newspaper sales in October, and highlights graph components like axes, scale, and labels for clarity.
Categories
Slides (13)
6 -
What month sold the most newspapers?
8 -
How many newspapers were sold in October?

10 -
How many days were windy?

12 -
What is the scale of this graph?

Similar Templates
Frequently Asked Questions
How do I access the AhaSlides template library?
You can access templates from the Templates tab in your dashboard after logging in, from the Templates section on our website, or directly in the Editor app.
What are the templates designed for?
Official templates help you prepare interactive presentations for training, meetings, classes, and workshops. Community templates are created by users and shared to inspire others.
How do I host a session using a template?
Select a template, customize it by editing slides, themes, multimedia, and settings, then host it just like any other presentation.
Do I need to pay to use templates?
All templates are free to download and host, but some may exceed the free plan limits (5 quiz questions or 3 polls), which require a paid plan.
If I publish a template to share with my team, will it be visible to all other users?
Yes. Published templates are added to the public library and visible to all users. To keep a template private, share it with team members as collaborators instead.