The all-in-one platform for interactive and engaging presentations
The all-in-one platform for interactive engaging impactful presentations

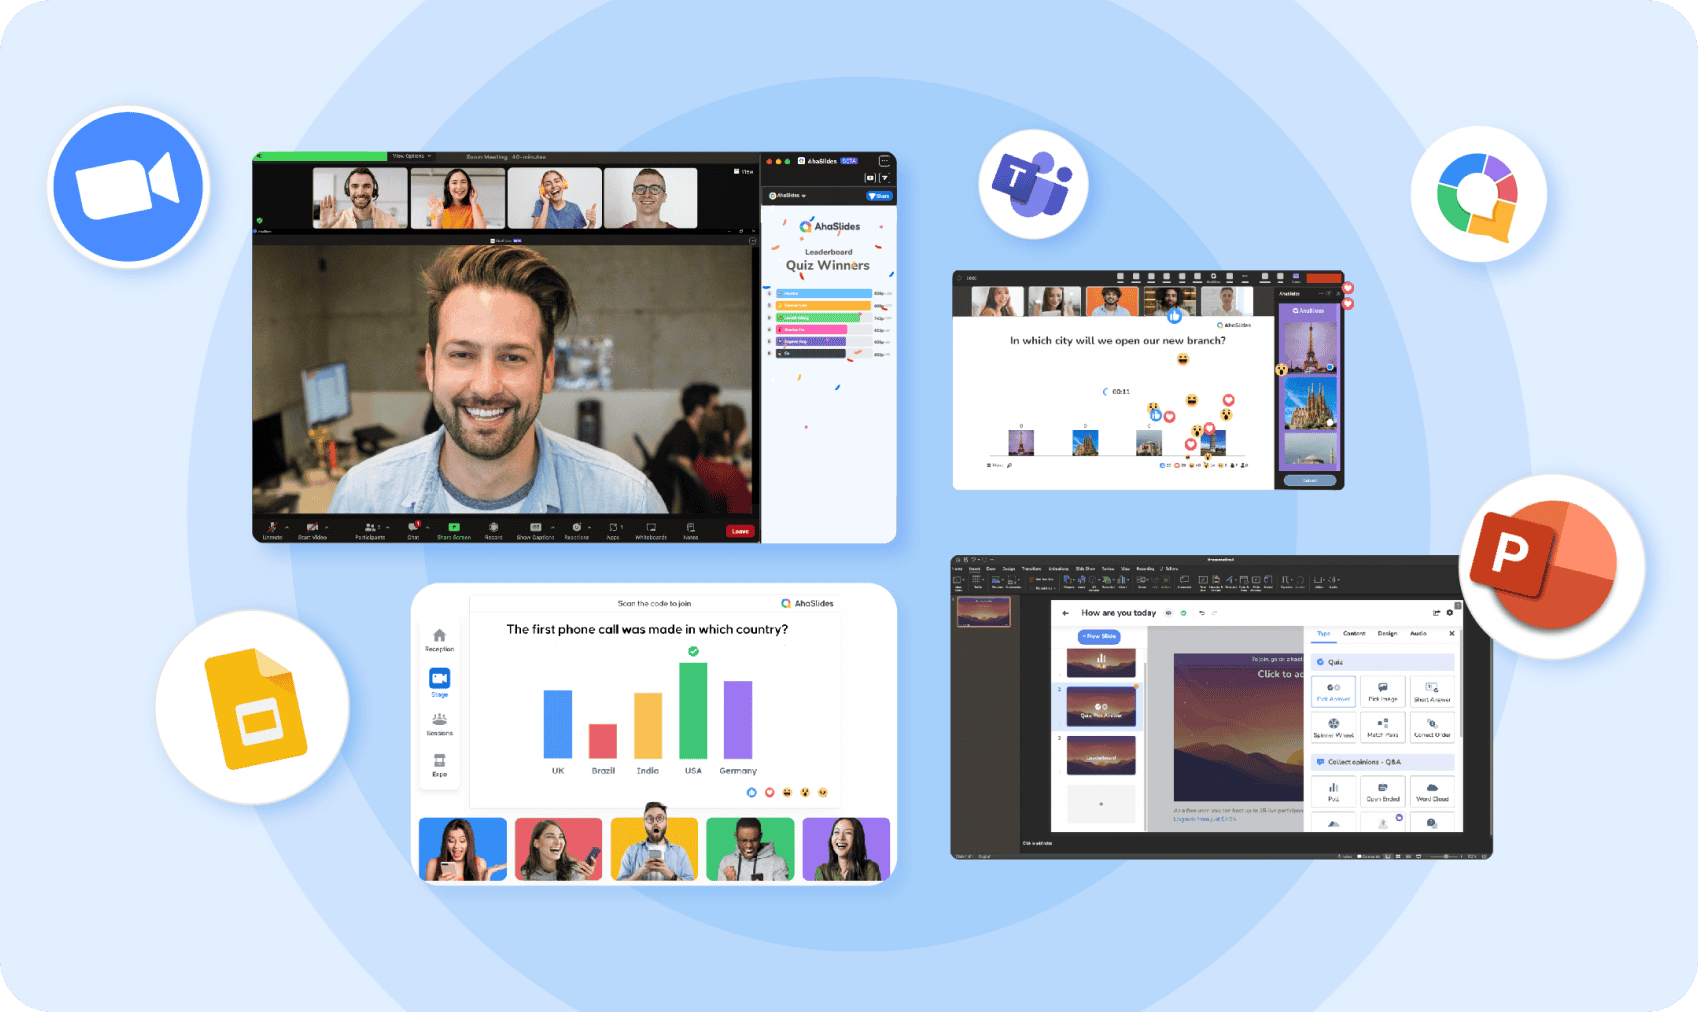
Works with
Trusted by Over 2M+ Educators and Business Professionals All Over The World
Ready-made Slides
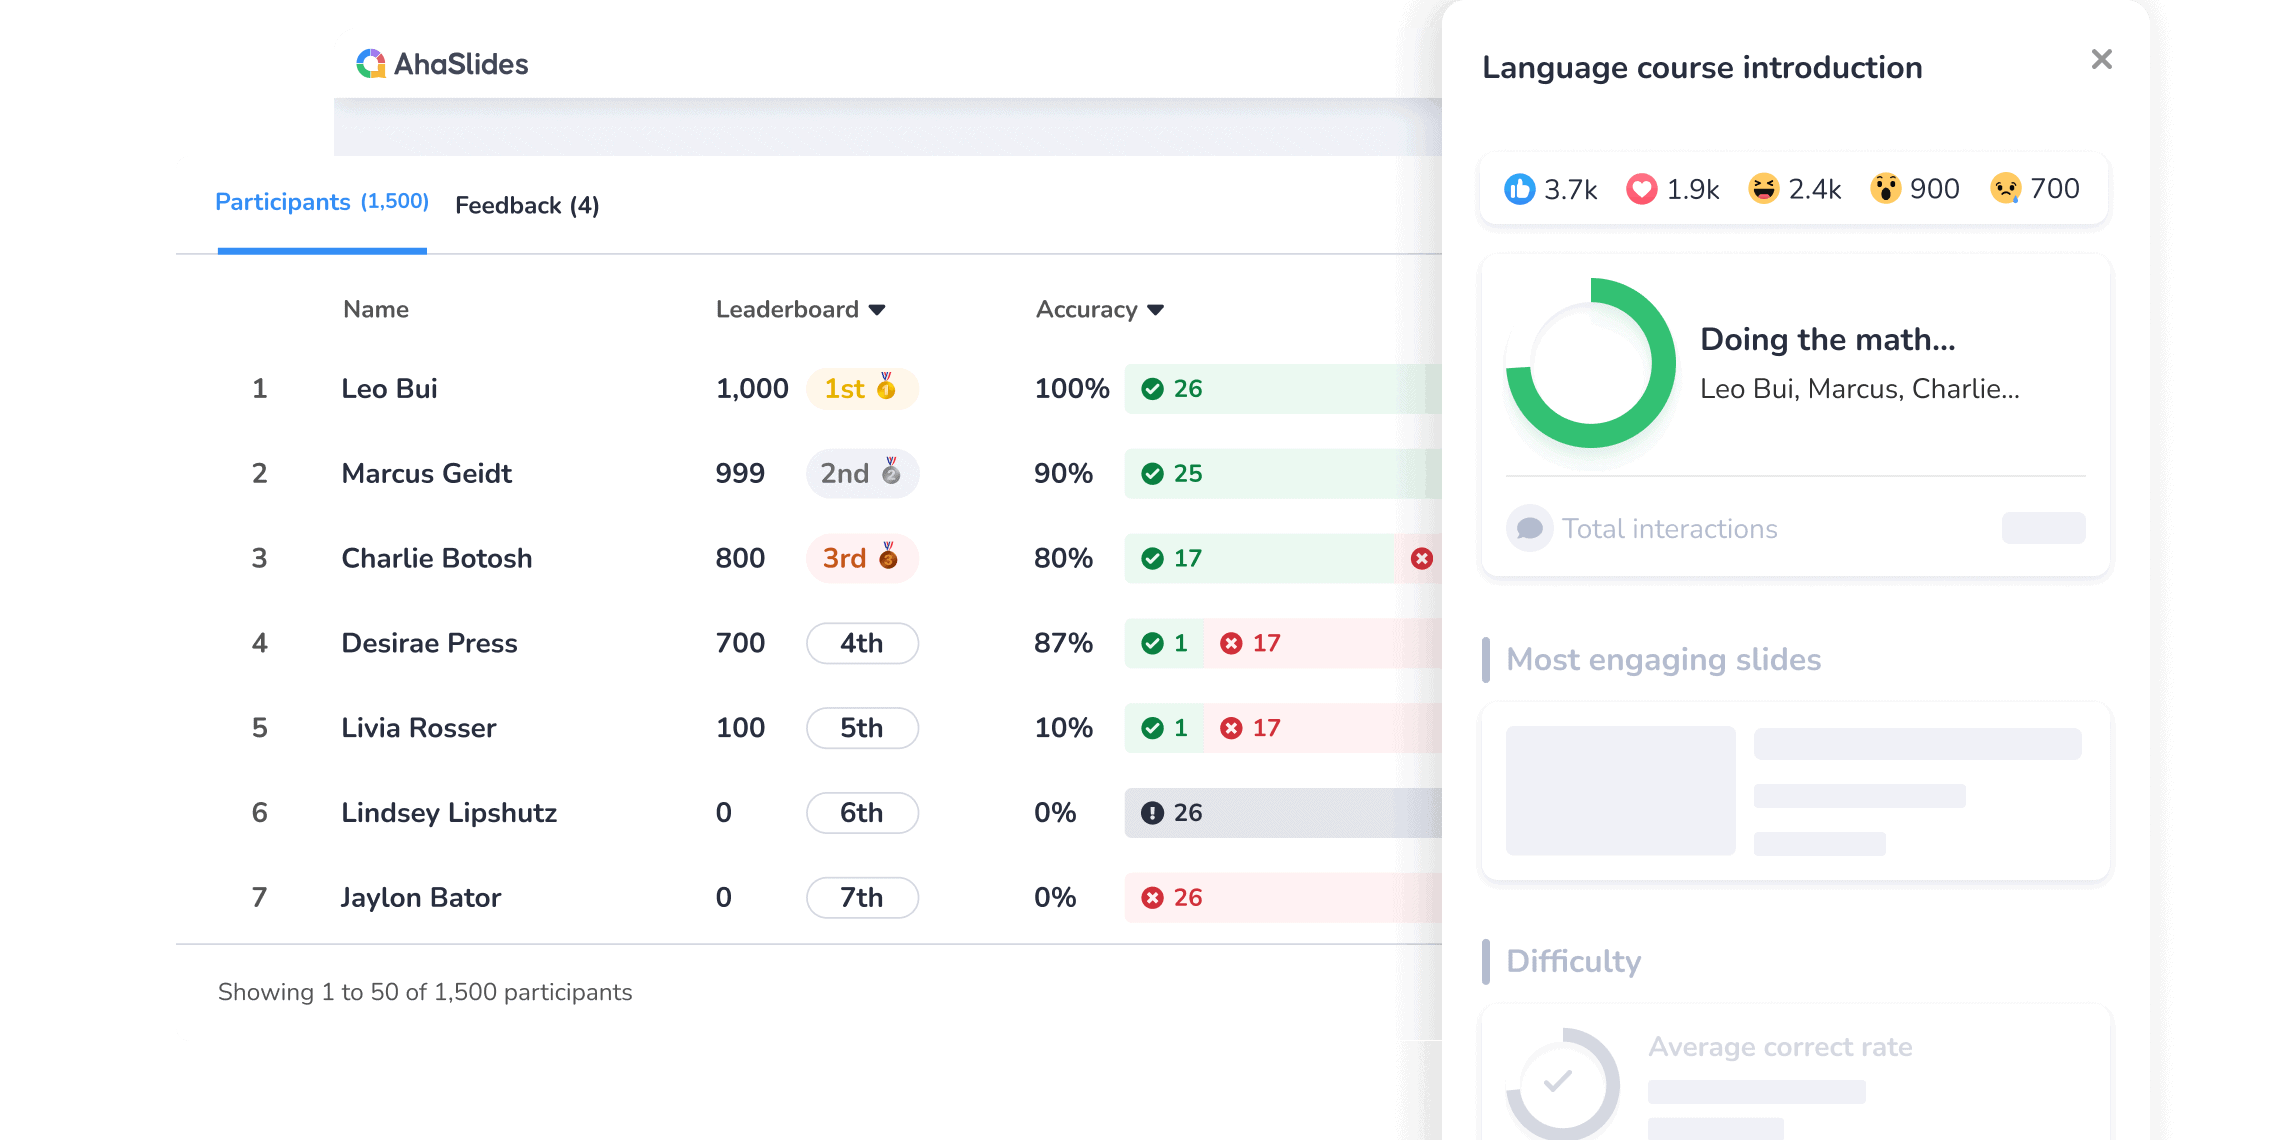
See how AhaSlides works in 1 minute.


Discover the #1 effective tool to maintain attention and drive participation.
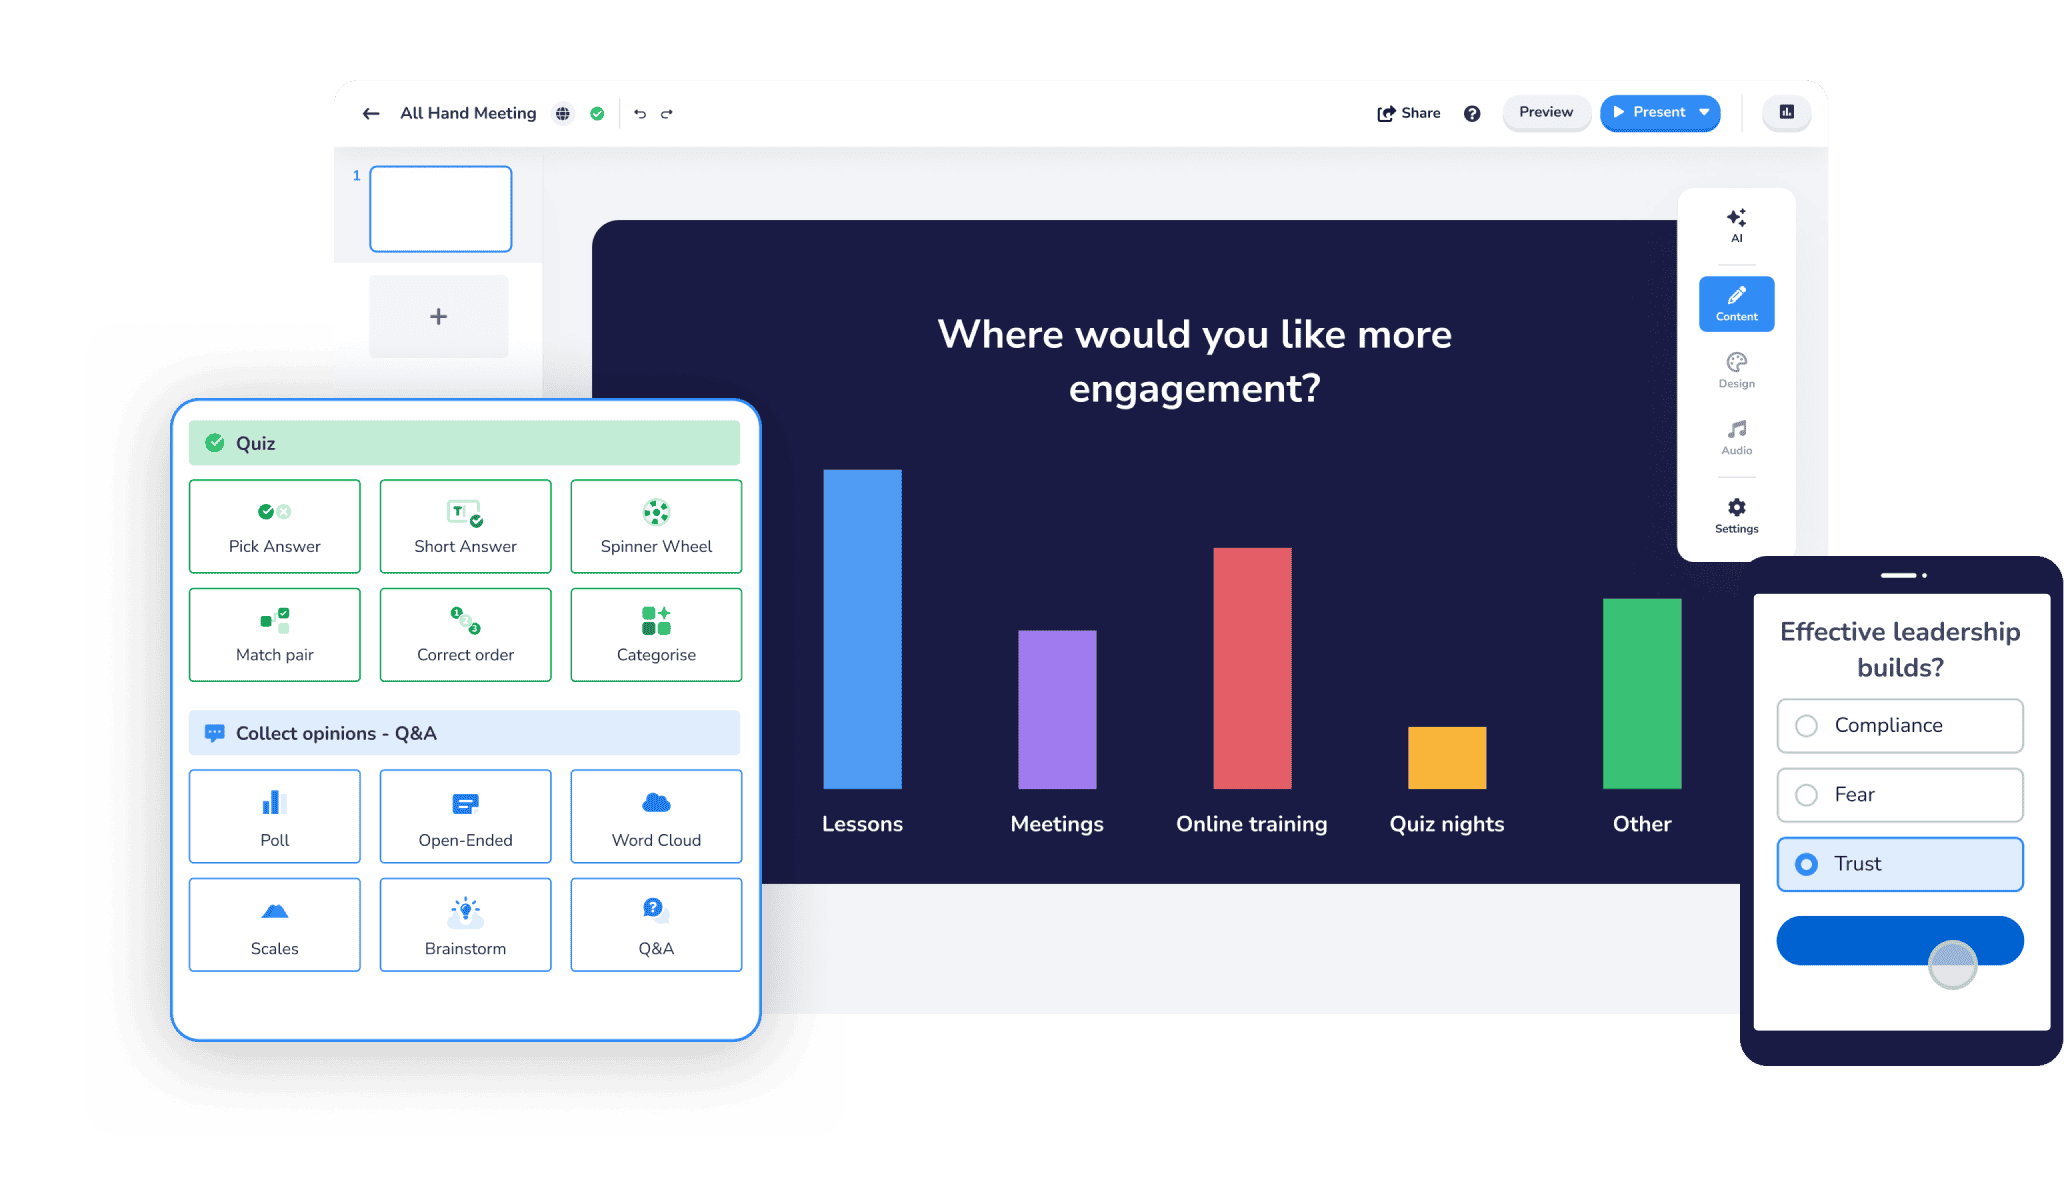
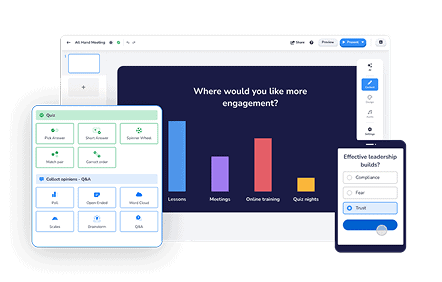
Interactive Presentations for Every Use Case


Customers love us. 

2M+
Users Worldwide
142k
Businesses Use Us
99.97%
Uptime in last 90 days

Talent Development and Training Coordinator

Education & Content Specialist

Workplace Learning and Development Leader
Talent Development and Training Coordinator
Education & Content Specialist
Workplace Learning and Development Leader
Talent Development and Training Coordinator
Education & Content Specialist
Workplace Learning and Development Leader
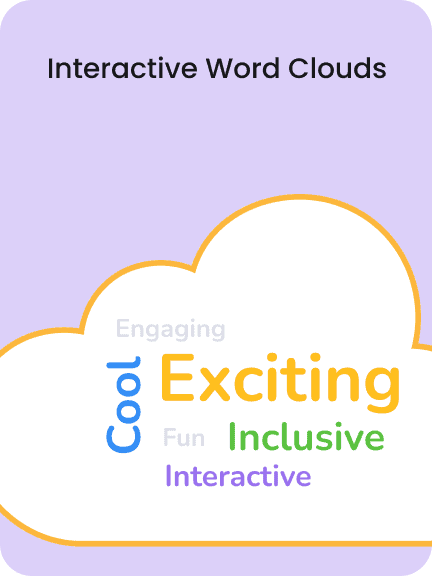
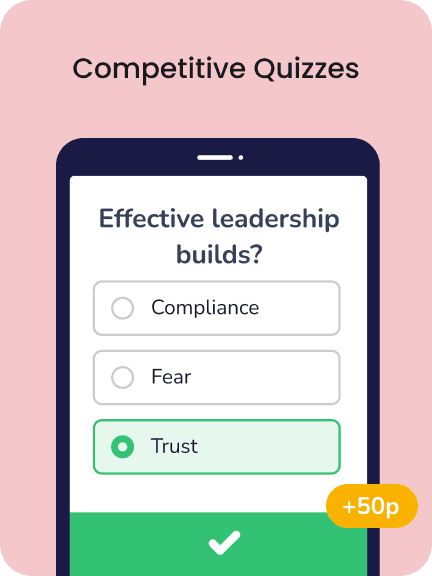
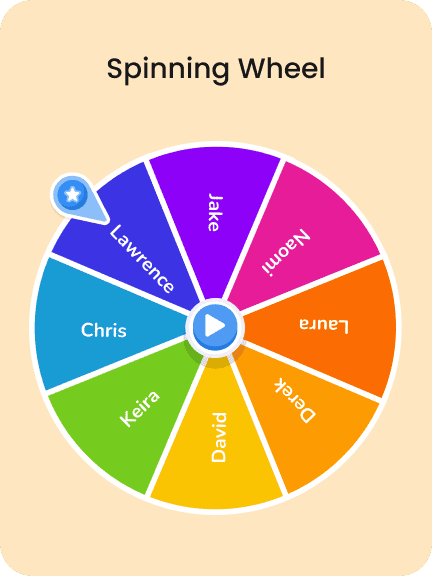
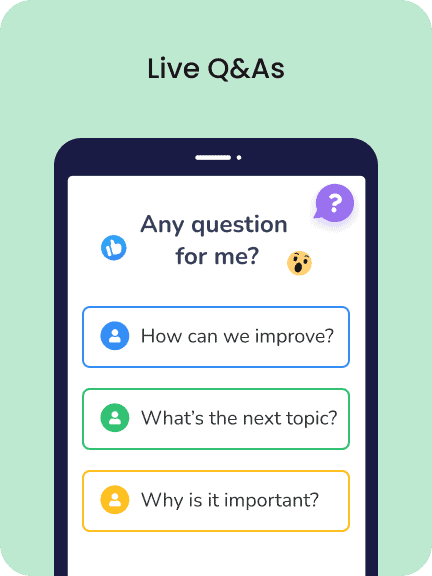
Captivate your audience with 
Get started. It’s free!

Frequently asked questions
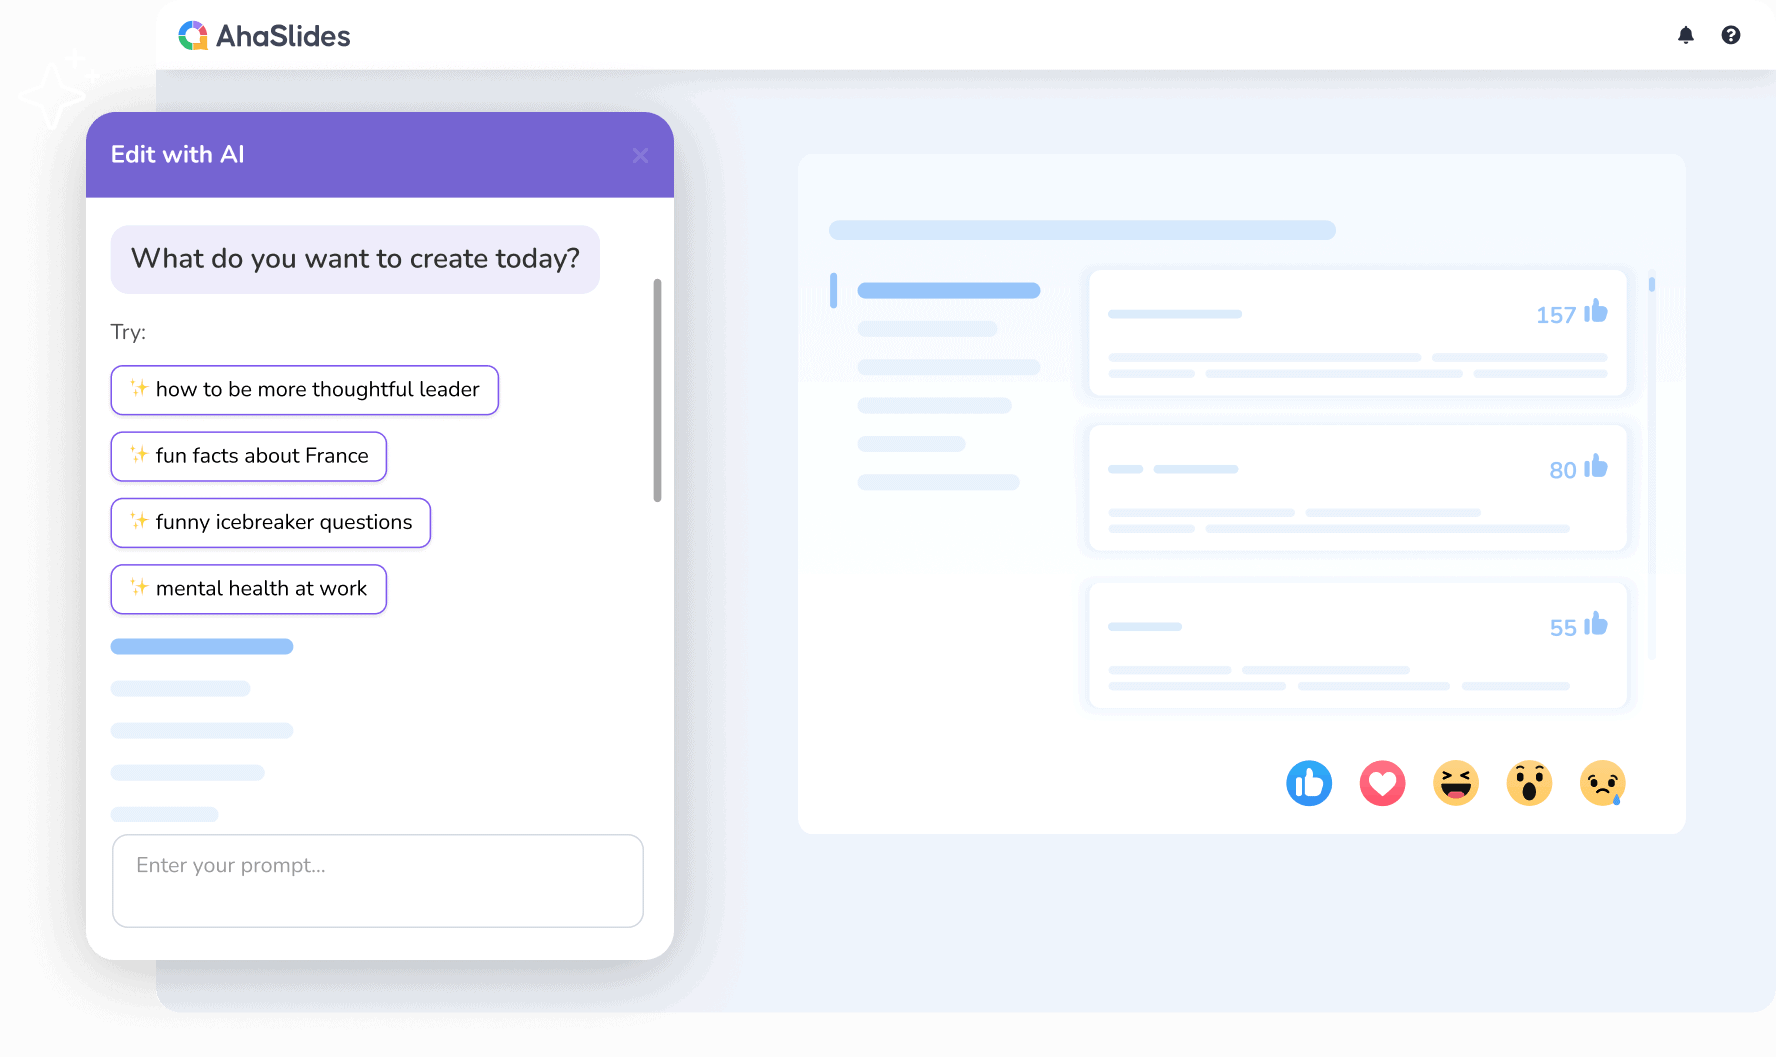
What is AhaSlides?
AhaSlides is a cloud-based interactive presentation software designed to make presentations more engaging. We let you include beyond-static-slide features such as AI-powered quizzes, word clouds, interactive polls, live Q&A sessions, spinner wheel and more directly to your presentation. We also integrate with PowerPoint and Google Slides to boost audience engagement.
Is AhaSlides free?
Yes! AhaSlides offers a generous free plan that includes:
- Presenting up to 50 live participants
- Unlimited use of AI credits
- Unlimited presentation creation
- Over 3000 templates
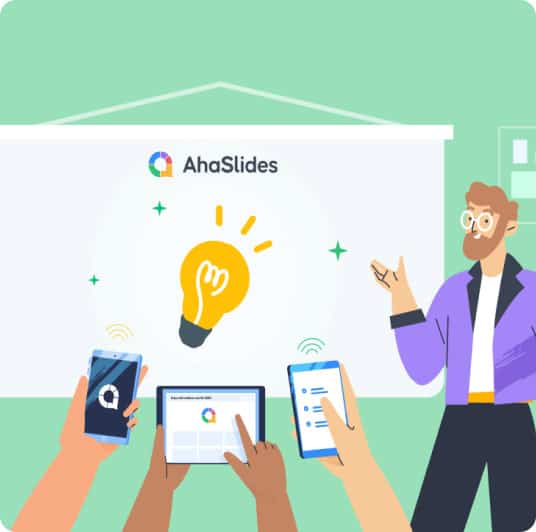
How does AhaSlides work?
- Create your presentation with interactive elements
- Share a unique code with your audience
- Participants join using their phones or devices
- Interact in real time during your presentation
Can I use AhaSlides in my PowerPoint presentation?
Yes. AhaSlides integrates with:
- PowerPoint
- Google Ecosystem (Google Drive & Google Slides)
- Microsoft Teams
- Zoom
- RingCentral Events
What makes AhaSlides different from Kahoot and other interactive tools?
How AhaSlides works is similar to Kahoot but while Kahoot focuses primarily on quizzes, AhaSlides offers a complete presentation solution with diverse interactive features. Beyond gamified quizzes, you get professional presentation tools like Q&A sessions, more poll question types and spinner wheels. This makes AhaSlides ideal for both educational and professional settings.
How secure is AhaSlides?
We take data protection and security seriously. We’ve taken all the necessary steps to ensure that our user data is kept safe at all times. To know more, please check out our Security Policy.
Can I get support if needed?
Absolutely! We offer:
- 24/7 customer support
- Help documentation
- Video tutorials
- Community forum