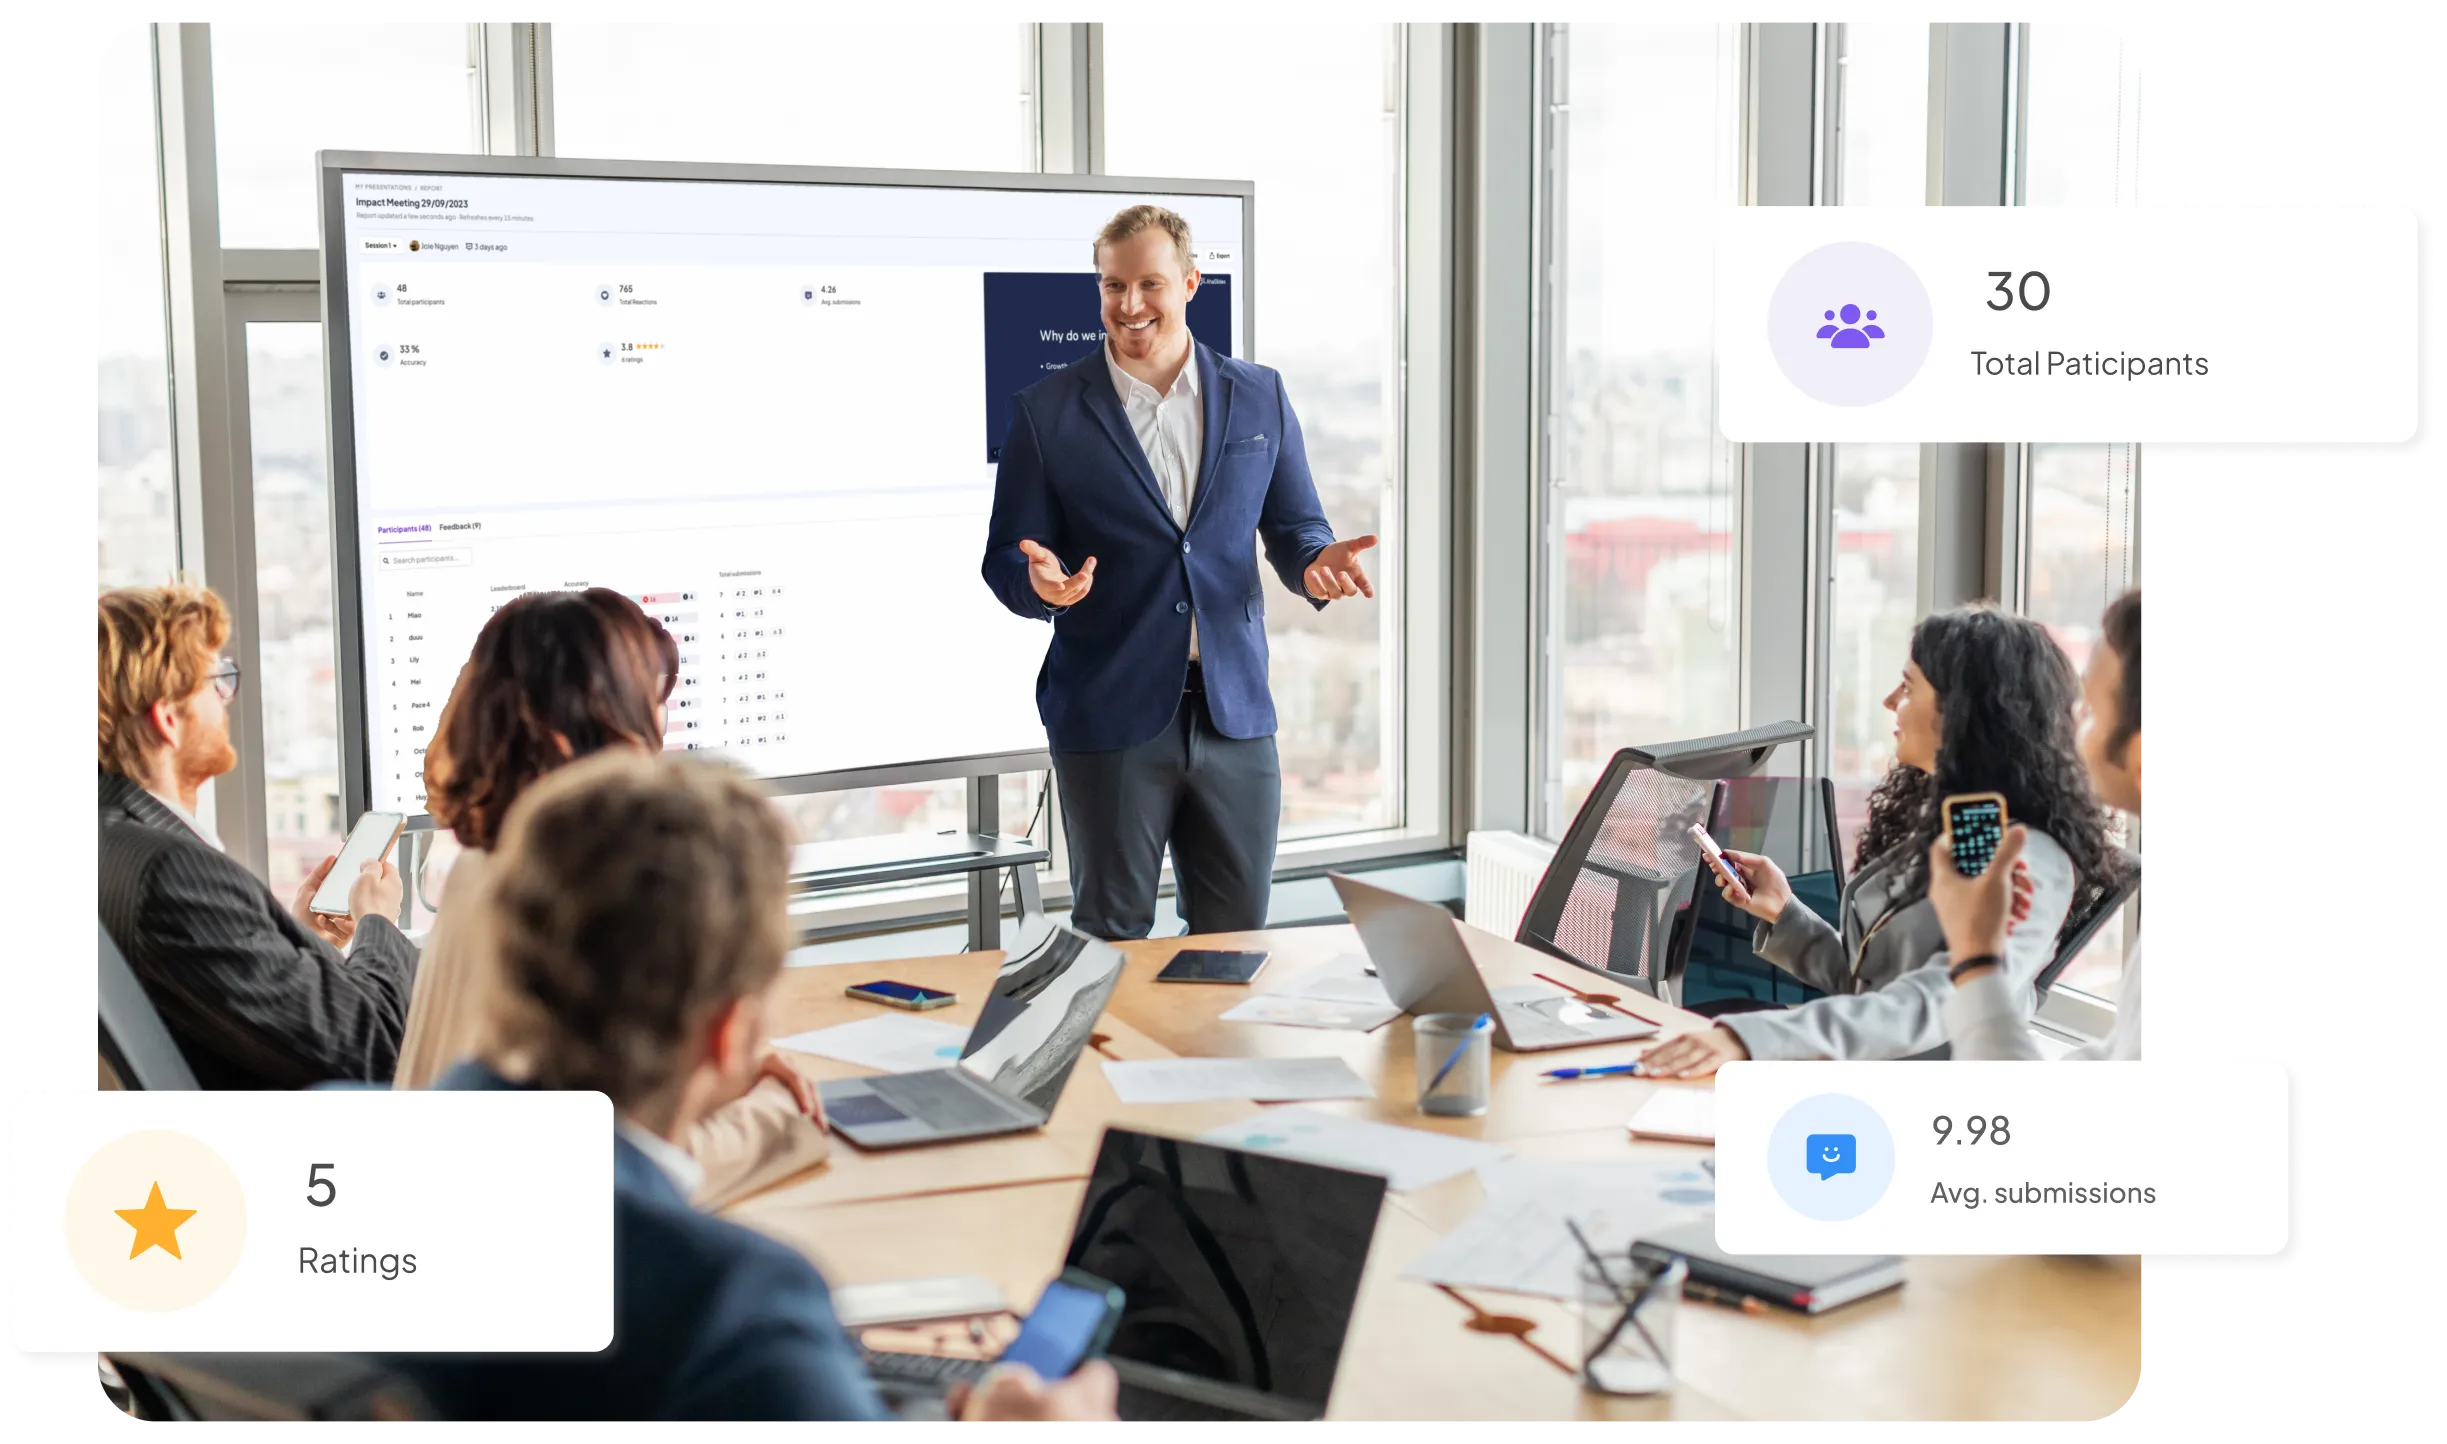
Track your event performance inside and out

See how your audience engage and measure your meeting success with AhaSlides' advanced analytics and report feature.

TRUSTED BY 2M+ USERS FROM TOP ORGANISATIONS WORLDWIDE

Easy data visualisation

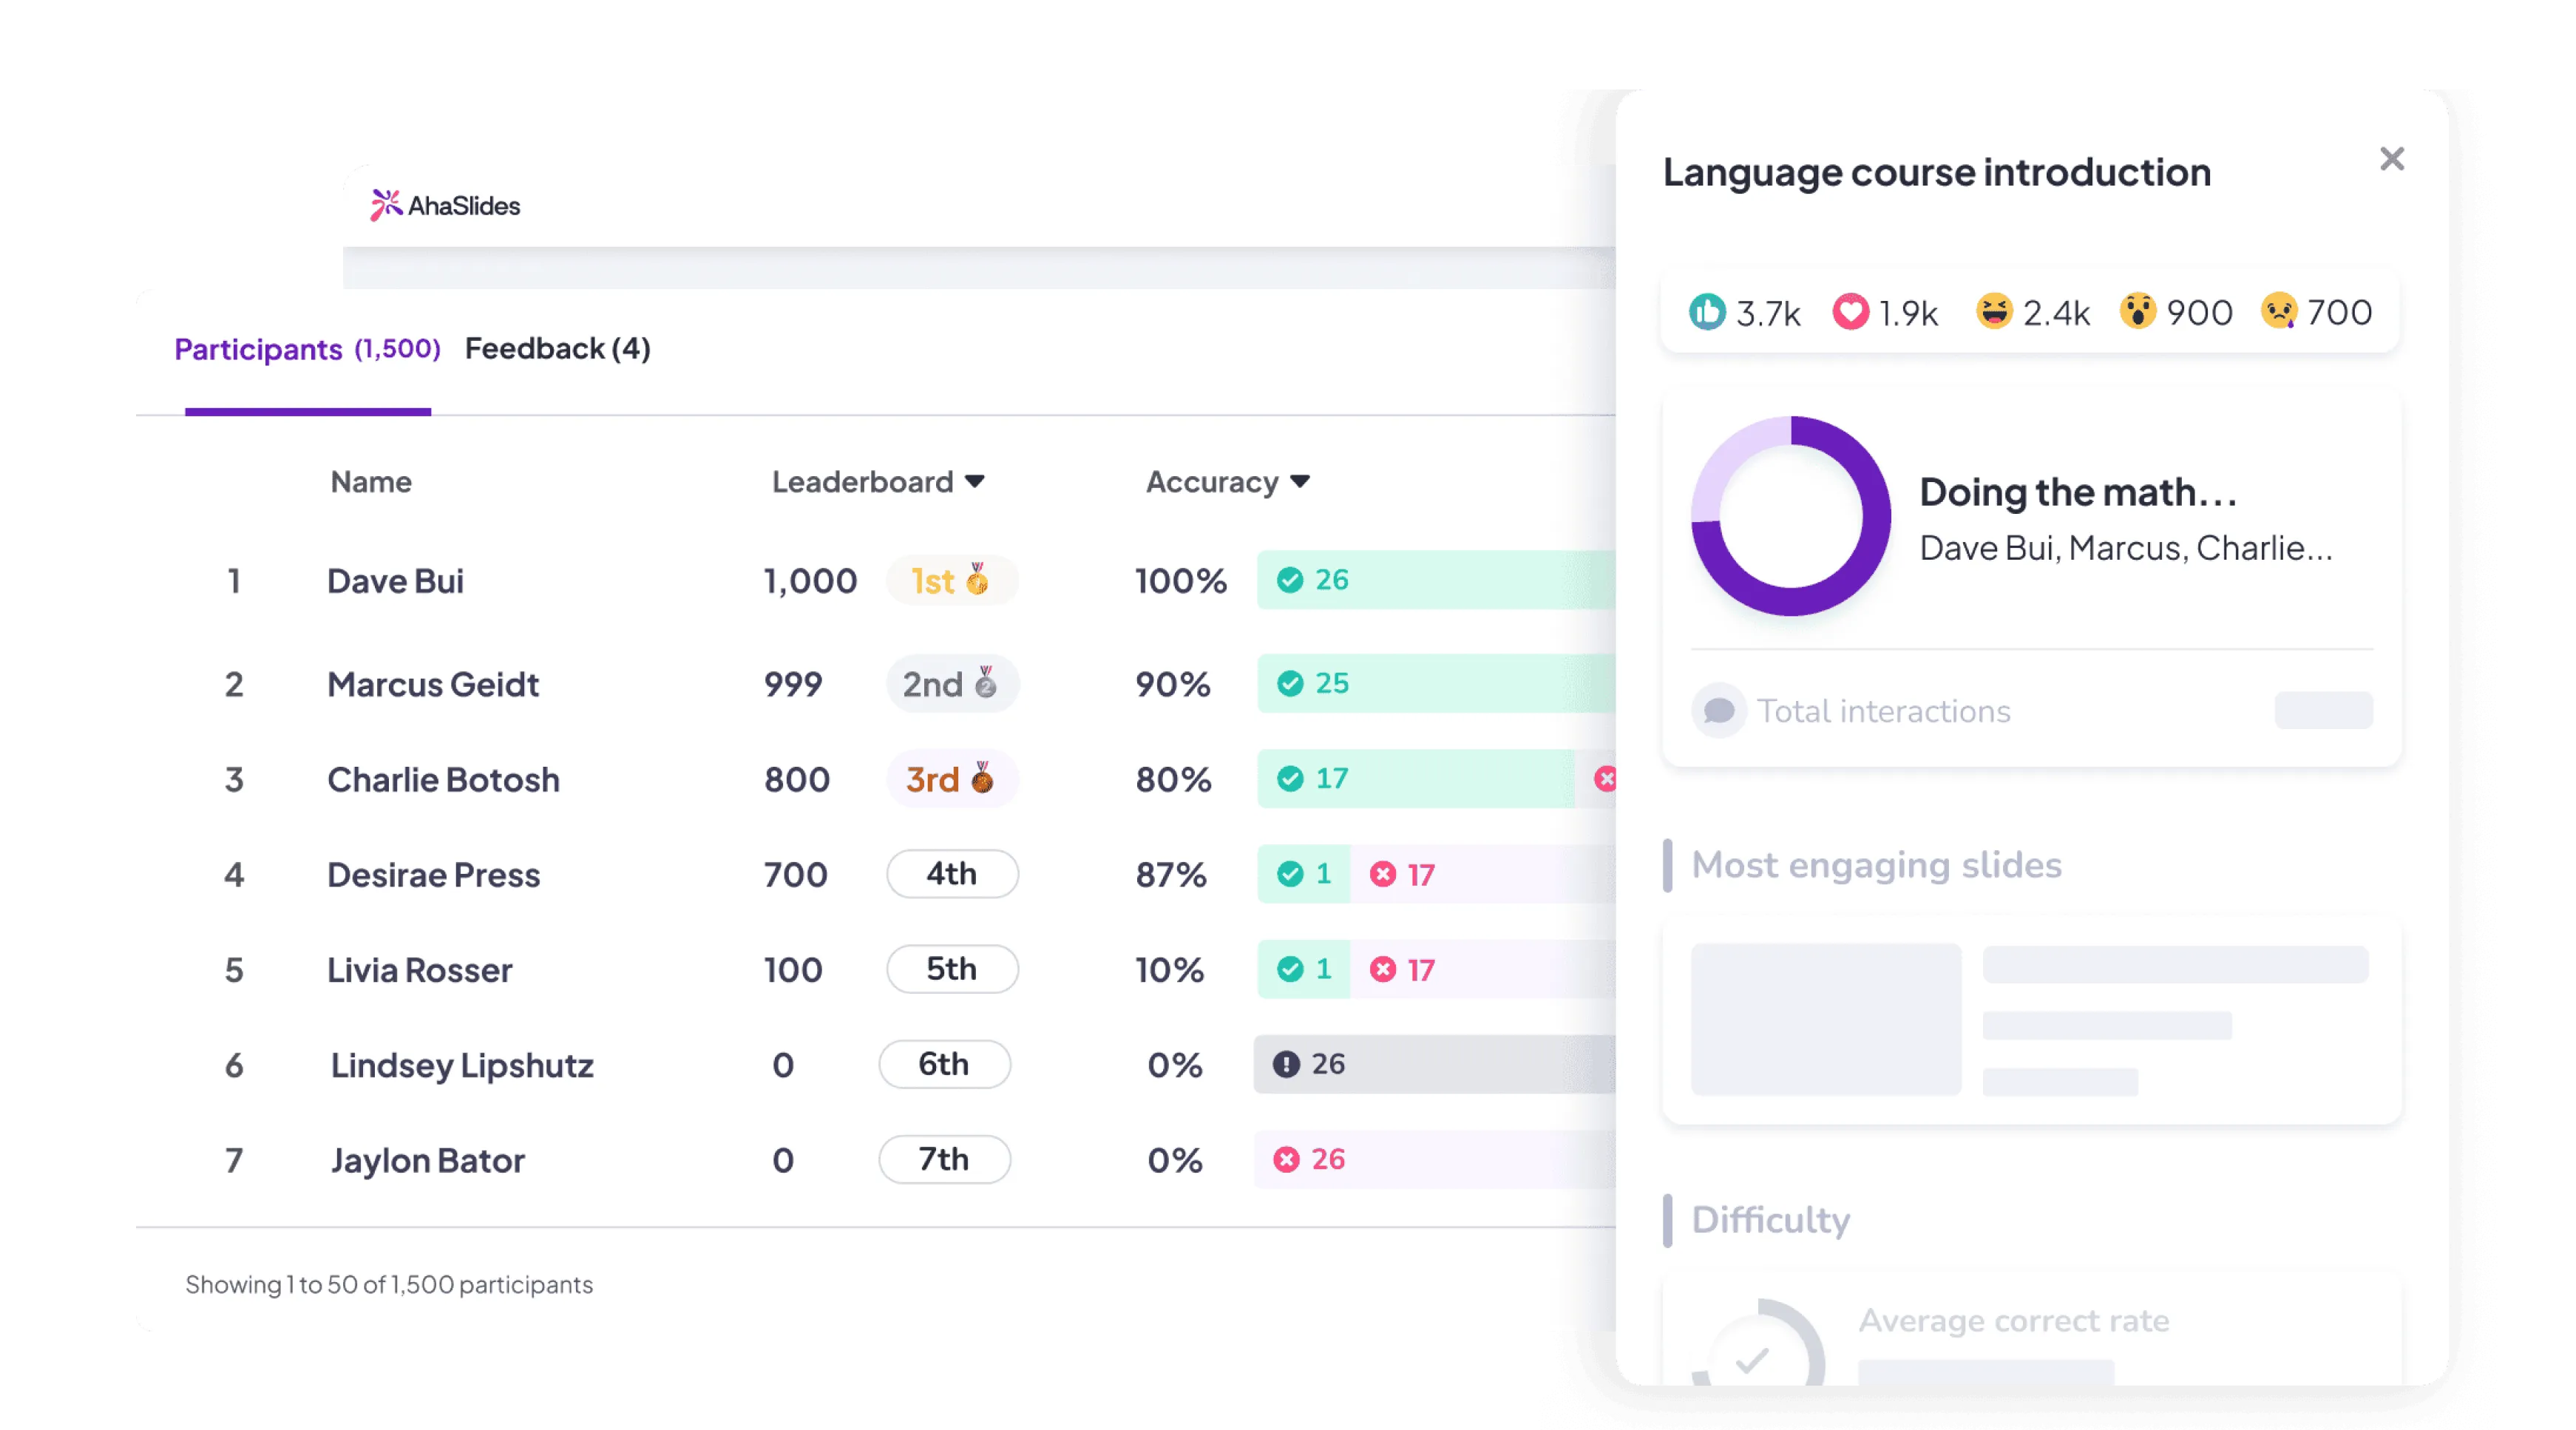
Get a quick snapshot of audience involvement

 AhaSlides' event report enables you to:

  • Monitor engagement during your event
  • Compare performance across different sessions or events
  • Identify peak interaction moments to refine your content strategy
ahaslides report and analytic feature

Unveil valuable insights

Detailed data export

AhaSlides will generate comprehensive Excel reports that tell your event's story, including participants' info and how they interact with your presentation.

Smart AI analysis

Mine sentiments behind

Encapsulate the overall mood and opinions of your audience through AhaSlides' smart AI grouping - now available for word cloud and open-ended polls.

AhaSlides smart AI grouping

How organisations can leverage AhaSlides report

Frequently asked questions

What kind of data can I collect?

Our analytics feature lets you analyse a wide range of data like quiz, poll and survey interactions, audience feedback and rating on your presentation session, and more.

How can I access my reports and analytics?

You can access your report directly from your AhaSlides dashboard after conducting a presentation.


How can I measure audience engagement using AhaSlides reports?

You can measure audience engagement by looking at metrics such as the number of active participants, the response rate to polls and questions, and the overall rating of your presentation.

Do you provide custom report?

We provide custom report for AhaSliders who are on the Enterprise plan.

Connect your favourite tools with AhaSlides

Check out AhaSlides guides and tips

Let data unlocks authentic engagement.