



Excel has no built-in word cloud. Microsoft’s own list of available chart types in Office runs from column and bar charts to maps and funnels, and a word cloud is not on it. So an Excel word cloud always means doing one of three things: install an add-in, paste your column into a free generator, or send the data to Power BI.
This guide walks through all three with the same example: a column of one-word answers from a workshop feedback form. If you want a tool roundup instead, see our comparison of collaborative word cloud tools.
Prepare the column first (all three methods)
Every method reads a list of words, so a little tidying in Excel pays off. Here is the sample data we used: 20 answers to “In one word, how did the workshop feel?” typed into A2: A21, with “Answer” as the header in A1.
- Trim and lowercase. A stray trailing space makes “clear ” and “clear” count as two different words in COUNTIF. In B2 enter
=LOWER(TRIM(A2))and fill down. See Microsoft’s guides to TRIM och LÄGRE. - Remove stop words. For free text (sentences rather than single words), filter out words like “the”, “and” and “is” so they do not dominate the cloud.
- Count the words. Copy B2:B21 to D2, select those cells and choose Dataoch sedan Ta bort dubbletter (see Microsoft’s remove duplicates guide). In E2 enter
=COUNTIF($B$2:$B$21,D2)and fill down (see COUNTIF). On Microsoft 365, Excel 2021 or later you can skip Remove Duplicates and enter=UNIQUE(B2:B21)in D2 instead (UNIK).
For our sample the frequency table comes out like this, which gives you something to check each word cloud against:
| ord | Att Räkna |
|---|---|
| energigivande | 5 |
| klar | 5 |
| hjälp | 4 |
| rusade | 2 |
| lång | 2 |
| praktisk | 2 |
A word cloud shows relative size only, so keep this table next to it when exact counts matter. Our own cloud made from the same column is further down.
Method 1: use an Excel add-in
An add-in builds the cloud inside Excel, so the words stay linked to your sheet. A well-known option is Bjorn’s Word Clouds. It is not free: the developer lists a subscription of $8.95 a month with a 7-day free trial, so check the current price before you commit.
Install the add-in
- Öppna Insert fliken och klicka Skaffa tillägg.
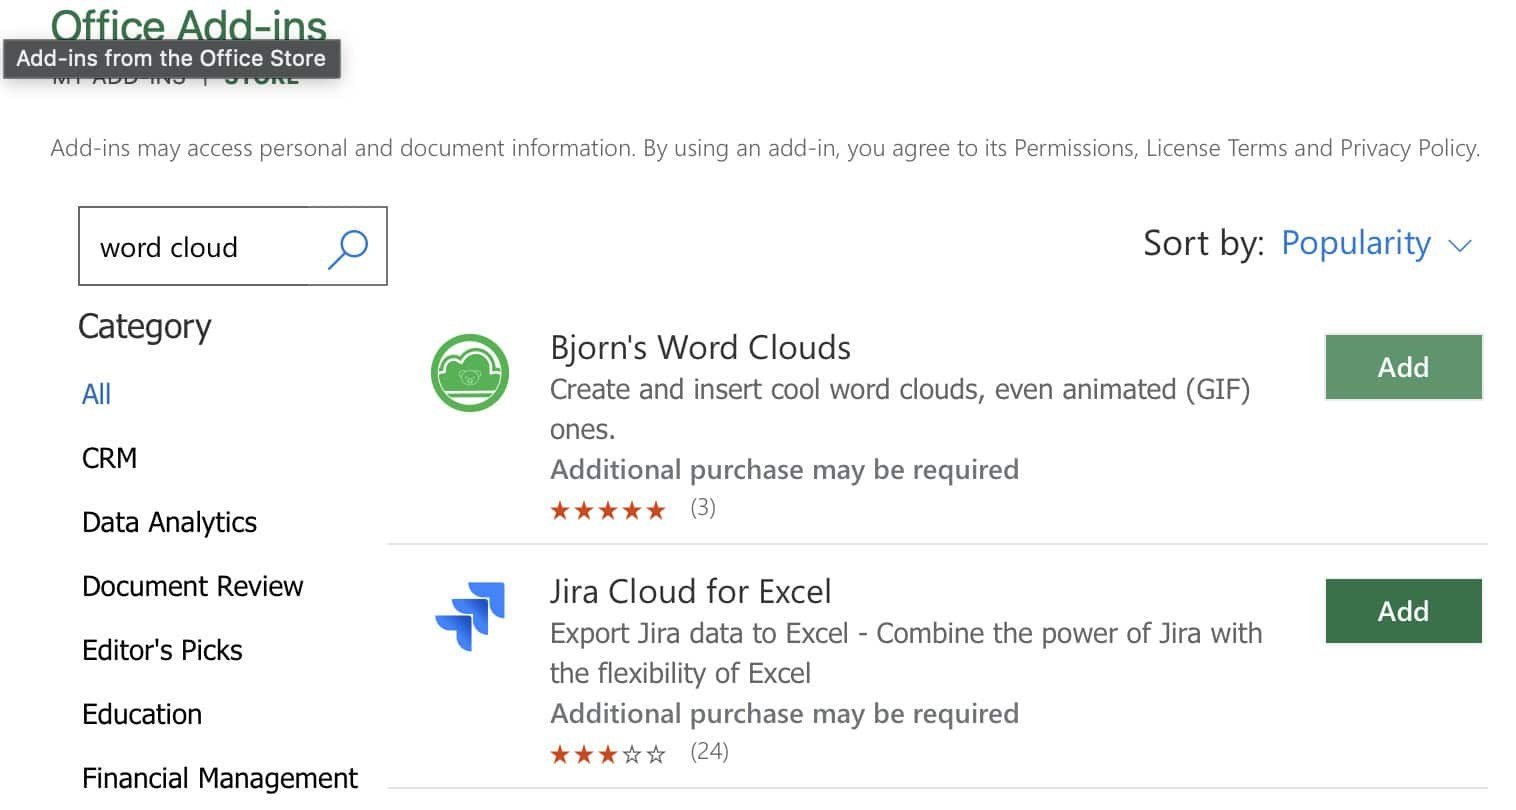
- In the Office Add-ins store, search for “word cloud”.
- Klicka Lägg till next to “Bjorn’s Word Clouds”.
Generate the cloud
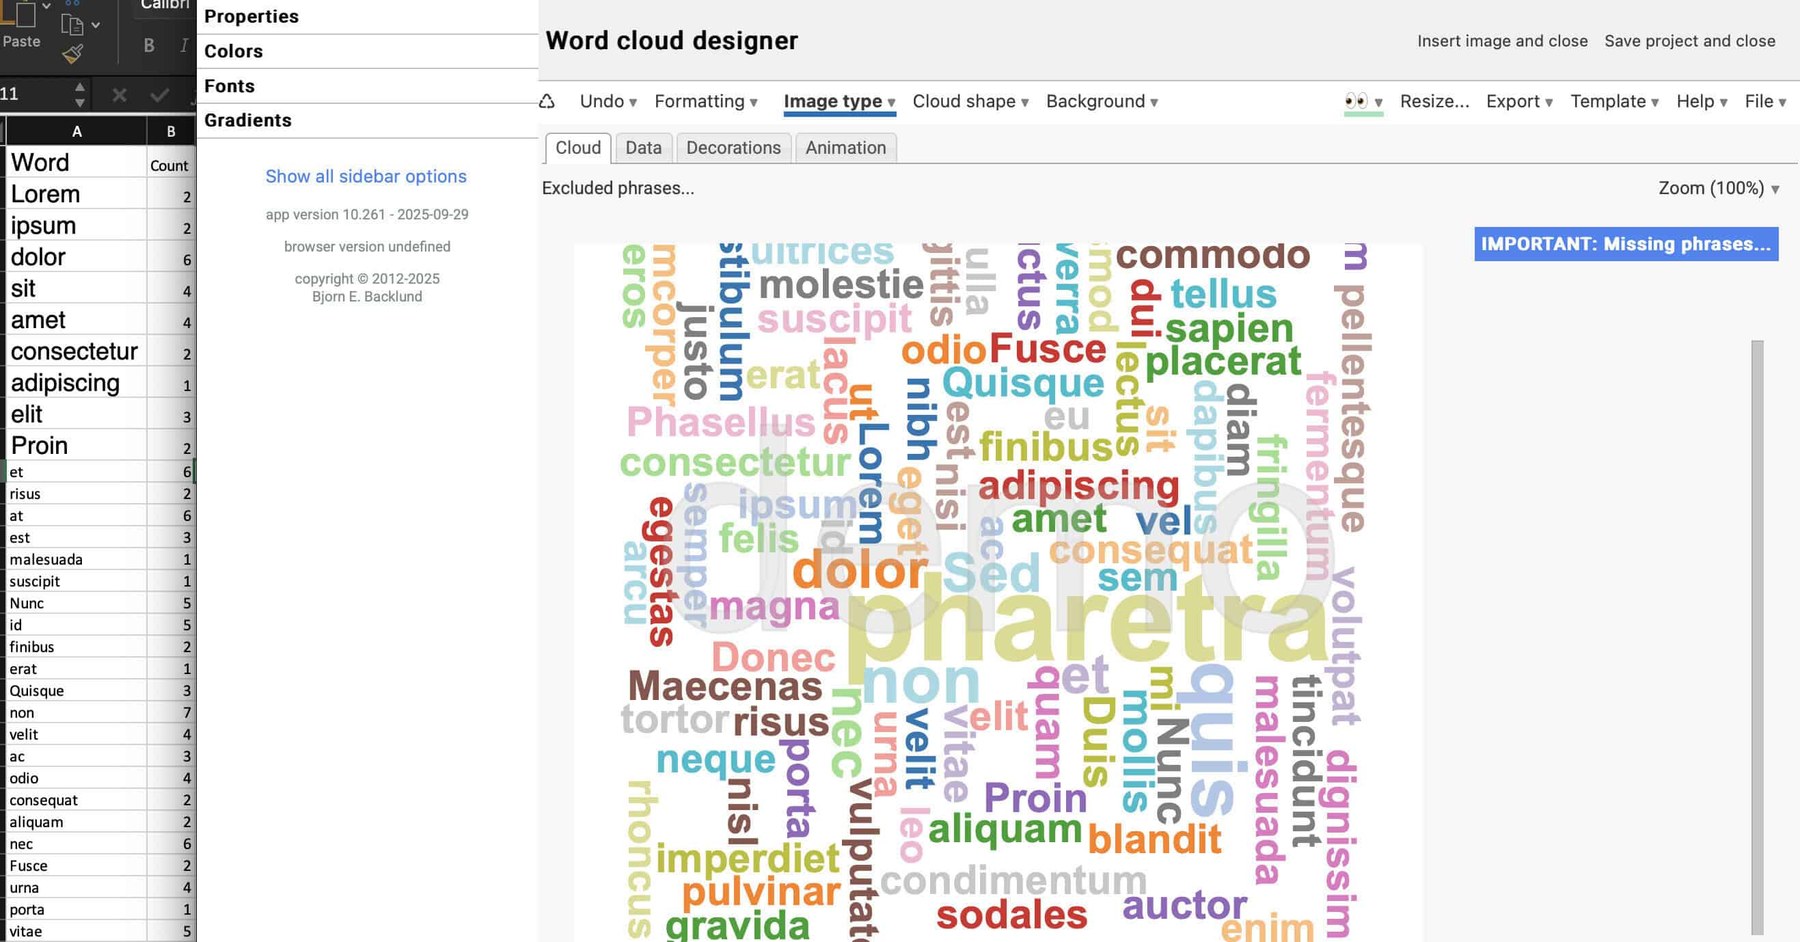
- Gå till Insertoch sedan Mina tillägg, and open the add-in. Its panel appears on the right of your sheet.
- Select your word list (or your word and count columns). The add-in picks up the selected range.
- Choose the font, colours, layout and word orientation, and set how many words to show.
- Export the cloud as an image, an animated GIF or a web page.
Method 2: paste your column into a free online generator
If you do not want to install anything, copy the column and paste it into a web tool. The AhaSlides levande ordmolngenerator works this way: no sign-up is needed to try it, and each repeated word makes that word larger.
Worked example with our 20 answers
- In Excel, select B2: B21 (the cleaned words) and press Ctrl + C.
- Open the generator and paste into the Dina ord box. Each line is read as one word.
- Klicka Generera. The tool reported “6 unique words”, the same six as our frequency table.
- Använda Färger, Font, Bakgrund och Vinklar to restyle it, Blanda layout to rearrange it, then Hämta PNG.
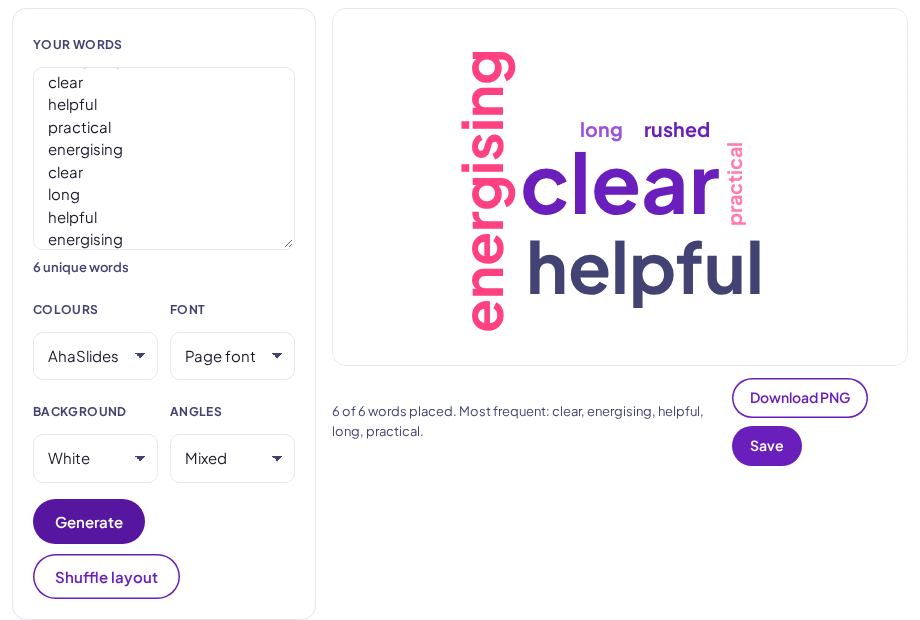
Because the tool counts repeats, you can paste the raw column and skip the COUNTIF step. Paste the cleaned column all the same: it keeps your COUNTIF table and the cloud in step, and not every tool ignores stray spaces.
Need the audience to supply the words live instead of collecting them in Excel first? That is what the AhaSlides ord moln bild is for: people type answers on their phones and the cloud builds on screen. Our live word cloud examples show where it works well.
Method 3: use Power BI
Power BI suits you when you have thousands of rows. It does not ship a word cloud in its standard visuals, so you add one from AppSource first.
Connect your workbook
- In Excel, select your text column and press Ctrl + T to make it a table. Give the table a clear name such as “WordData”, then save the file.
- Open Power BI Desktop (a free download from Microsoft). På Hem flikval Hämta dataoch sedan Excel-arbetsbok, and open your file. Microsoft’s guide to connecting to Excel täcker alternativen.
- I Navigator, tick your table and click Ladda.
Add the word cloud visual
- I visualiseringar pane, click the ellipsis (…) and choose Get more visuals.
- Search AppSource for “Word Cloud” and click Lägg till. Microsoft explains this step in its guide to importing visuals from AppSource.
- Select the new Word Cloud icon, then drag your text column into the Kategori field. Power BI counts how often each word appears and sizes it to match.
Vilken metod ska du välja?
| Lägga in | Online-generator | Power BI | |
|---|---|---|---|
| Pris | Paid subscription after a 7-day trial | gratis att prova | Free desktop app |
| Bäst för | Cloud kept inside the workbook | Quick one-off graphic | Large datasets and reports |
Tips for a readable Excel word cloud
- Clean first: lowercase, trim spaces and strip stop words and punctuation.
- If the words are spread over many cells, join them with
=TEXTJOIN(" ",TRUE,A2:A51). TEXTJOIN needs Excel 2019 or later (see Microsoft’s TEXTJOIN guide). - Merge near-duplicates (“meeting” and “meetings”) before counting.
- A cloud shows rank at a glance but not exact numbers. Pair it with the frequency table or a bar chart when someone needs the figures, as in the table above.