
You spent an hour writing the questions. You hit send. Twelve people responded out of 400.
That gap is not a reflection of how much people care about your topic. It is a reflection of how easy or difficult you made it to say yes. The average online survey response rate sits between 10% and 30% depending on channel and audience [1], and most organizations sit at the low end of that range without knowing why.
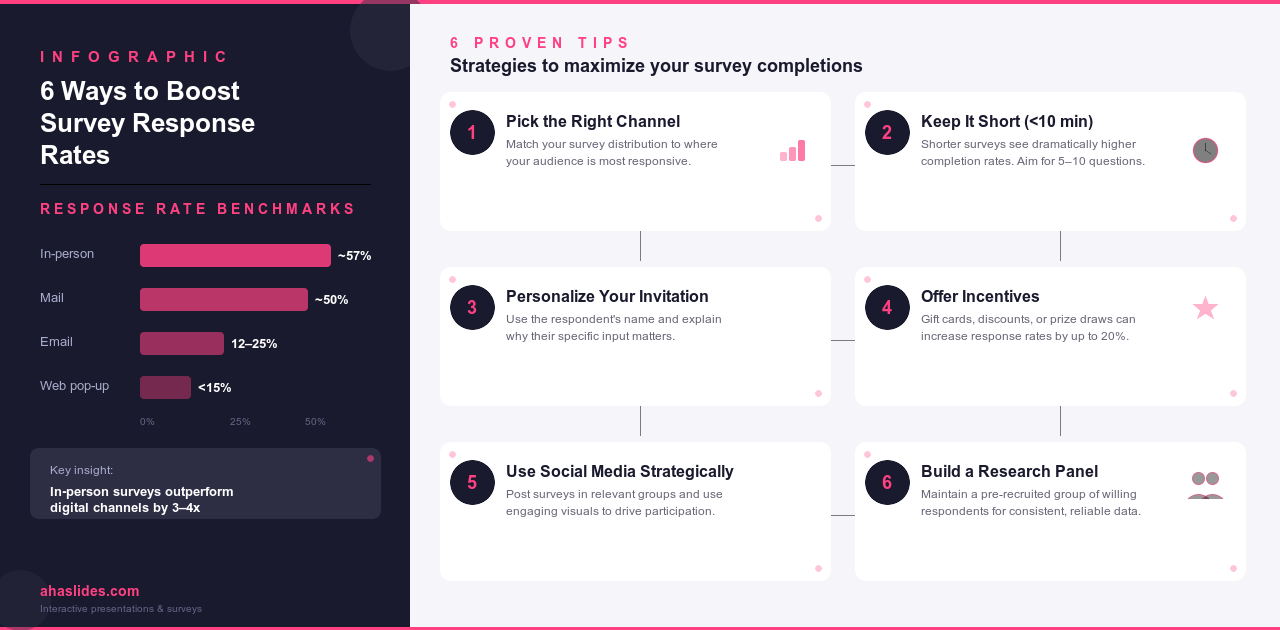
Here are six things that make a measurable difference.
What is survey response rate?
Survey response rate is the percentage of people who fully completed your survey. To calculate it, divide the number of completed responses by the total number sent, then multiply by 100.
For example: 90 completed responses out of 500 surveys sent = (90 ÷ 500) × 100 = 18%.
What counts as a good survey response rate?
Good response rates vary a lot by method. In-person surveys typically achieve 50% or higher because the ask happens face to face. Phone surveys land somewhere between 20% and 40%, depending on audience familiarity. Email surveys average 12% to 25% for most organizations, though internal surveys sent to employees tend to perform better than those sent to external customers. SMS surveys can reach 30% to 45% when the message is timely and the ask is short. Anonymous web pop-ups and in-app prompts sit at the low end, often below 15%, because the respondent has no prior relationship with the sender and no strong reason to stop what they are doing.
For most digital surveys, a 20% to 30% response rate is a realistic target. Getting there usually requires more than one of the tactics below working together.

1. Pick the right channel
The channel matters as much as the survey itself. In-person surveys consistently outperform email, which outperforms anonymous web pop-ups [1]. That gap exists because familiarity and context drive participation.
Before choosing a channel, work through four questions. Where does your audience already spend time? A survey sent through a channel your respondents check regularly will always outperform one sent through a channel they rarely use. How sensitive is the topic? Sensitive questions about management, pay, or workplace culture perform better through anonymous channels than through email, where the sender can see who responded. How quickly do you need results? In-person and SMS surveys return responses faster than email campaigns, which can take days to fully collect. And what is the respondent's relationship with you? Existing customers, current employees, and active community members respond at higher rates than cold or lapsed contacts, regardless of channel.
An L&D team at a mid-size tech company, for example, found that sending post-training surveys via SMS immediately after sessions (rather than emailing them the next day) lifted completion rates significantly. The message arrived when the experience was still fresh and respondents were already on their phones.
Gen Z employees in particular tend to respond better to SMS or in-app prompts than to email. Sending the wrong format to the right audience wastes the effort you put into writing the questions.
2. Keep it short
Survey length is one of the most consistent predictors of completion. Surveys that take more than 12 minutes see a clear drop-off in response rates [2]. For most use cases, aim for 10 questions or fewer, completable in under 10 minutes.
A few things help here. Show a progress indicator so respondents know how far they are through the survey. Cut any question that does not directly inform a decision you will actually make. If two questions are asking similar things, merge them. And tell people upfront how long it will take: 'This takes about four minutes' is more reassuring than leaving them to guess.
It also helps to review your survey from the respondent's perspective rather than the author's. What feels like a quick six-question form to the person who wrote it can read as repetitive or confusing to someone encountering it cold. A short review pass would ideally be done by someone unfamiliar with the project. It often reveals places where questions can be merged or cut entirely.
3. Personalize your invitation
Generic survey emails get treated like spam, because they often look exactly like spam. An email that starts "Hi, we would like to know what you think about our product" gives the recipient no reason to trust it or to care.
Compare these two approaches.
Generic: 'Hi, we would like to know what you think about our product. Please take a few minutes to complete this survey.'
Personalized: 'Hi Sarah, I'm following up on the onboarding session you completed last Tuesday. We're trying to understand what's working and what isn't, and your perspective would genuinely help. It takes about four minutes.'
The first could have been sent to anyone. The second shows the recipient was expected, gives a specific reason the feedback matters, and sets a realistic time expectation. Those three things together make it significantly harder to ignore.
Personalization doesn't need to be complex. At minimum, include the recipient's first name, use a real sender name (not a generic address), and reference something specific to the relationship.
4. Offer incentives
Financial incentives reliably increase response rates. Meta-analyses across survey methodology research show that monetary incentives raise response rates by 10–20 percentage points on average [3]. Prepaid incentives consistently outperform conditional rewards when provided upfront rather than promised after completion [3].
Incentives don't need to be large. For short surveys, small amounts ($2–$5) combined with good design produce strong results [3]. What matters more than the size is the relevance: a $10 gift card to a coffee chain will outperform a $10 donation to an unrelated charity if your audience drinks coffee.
Tools like Tango and Tremendous handle digital incentive fulfillment internationally, which simplifies distribution when your respondent pool is spread across regions.
One caveat: some participants will rush through a survey just to receive a reward. Including an attention-check question (e.g., "Please select 'Strongly agree' for this item") can help you filter out low-quality responses.
5. Use social media strategically
As of 2024, approximately 5.2 billion people use social media globally, making up roughly 64% of the world's population [4]. For surveys targeting consumer opinions, community feedback, or niche interest groups, social platforms give you access to audiences you couldn't reach by email.
The key is matching the platform to the audience. LinkedIn works well for professional topics: workplace practices, industry trends, career development, and B2B product feedback. The audience is already in a professional mindset and more likely to engage with work-related questions than they would be on a personal platform.
Facebook and Instagram reach broader consumer audiences and work well for lifestyle, community, or consumer product surveys. Engagement tends to be higher when the survey is embedded directly in the post rather than linked to an external form.
X (formerly Twitter) suits fast, single-question polls on current topics where a large, public-facing response is useful. The format is too limited for nuanced surveys but effective for quick directional data.
Niche communities on Reddit or Discord work particularly well when you need responses from a specific interest group. Members of a community built around a shared interest are far more likely to engage with a survey on that topic than a general population sample of the same size.
Running a survey about remote work preferences? A LinkedIn post in a relevant professional group will outperform a cold email list of the same size, because group members have already self-selected into a relevant community.
6. Build a research panel
A research panel is a pre-recruited group of respondents who have agreed in advance to answer surveys. Organizations that run frequent or longitudinal surveys, such as many HR and L&D teams, use panels to remove the cold-start problem of finding respondents for every new study.
The benefits are concrete: lower cost per response over time, faster fielding, and consistently higher response rates because participants already opted in. Panels also make it easier to ask sensitive questions (about compensation, management quality, or personal circumstances) because respondents understand the research context.
The trade-off is that panels work best when your target audience is stable. If the demographic you need to survey changes with each project, you'll spend more time maintaining the panel than it saves.
Question types that affect completion rates
How you ask questions affects whether people finish. A few formats consistently perform well:
Multiple choice questions are fast to answer and easy to analyze, but they can introduce bias if the response options don't reflect how respondents actually think. Pair them with an open-ended follow-up when the options might be incomplete.
Open-ended questions give respondents room to answer in their own words, but they require more effort. Place them after closed questions, once the respondent is already engaged, rather than at the start.
Likert scale questions measure attitudes across a spectrum (typically 5 or 7 points). They work well for satisfaction and agreement questions and are easy to visualize in results. Research on central tendency bias suggests people tend to avoid extreme options, so your results may cluster toward the middle [5].
Yes/no questions are the lowest-friction format. They're useful at the start of a survey to qualify respondents or narrow scope before asking more involved questions.
Ranking questions ask respondents to order options by preference, which tells you more about relative priorities than individual ratings. Use them when you need to understand trade-offs, not just approval levels.

Common mistakes to avoid
Even well-designed surveys can underperform when a few avoidable errors creep in. These are the ones that show up most often in L&D and HR contexts.
Timing affects whether your survey gets opened at all. Surveys sent on Friday afternoons or at the start of a busy week tend to get buried. Mid-week mornings, Tuesday through Thursday before noon, generally produce higher open rates for internal surveys. For post-event surveys, sending within 24 hours of the experience captures respondents while the context is still fresh.
Leading questions are the second common problem. A question like "How much did our training improve your performance?" assumes improvement happened. Respondents who saw no improvement either skip it or give an inaccurate answer. Neutral phrasing, such as "How would you describe the impact of this training on your day-to-day work?", produces more honest data and is easier to act on.
Skipping a pilot test is easy to do and consistently produces regret. Running your survey by two or three colleagues before full distribution catches broken logic, confusing wording, and questions that seem clear to the author but puzzle everyone else. Even a quick informal test reduces the risk of collecting unusable data from your entire sample.
Finally, neglecting mobile formatting. A significant share of survey responses now come from mobile devices. Surveys that rely on multi-column layouts, small tap targets, or wide tables are frustrating to complete on a phone. Test your survey on a mobile device before sending, and keep question formats simple enough to display cleanly on a small screen.
Running surveys with AhaSlides
AhaSlides combines live polls, rating scales, open-ended Q&A, word clouds, and quizzes in one platform. For HR teams and L&D facilitators, this means you can run pulse checks during a training session or town hall and see results in real time, rather than waiting a week for a post-event report nobody reads.
The live element changes the dynamic. When participants see group results aggregated as they answer, the data becomes a conversation starter rather than a data-collection formality. That immediacy tends to lift both completion rates and the quality of discussion that follows.
Frequently asked questions
Is 40% a good survey response rate?
Yes, 40% is above average for most digital survey methods. For email surveys, where industry averages typically land between 12% and 25% [1], a 40% rate indicates strong audience engagement.
What is the worst-performing survey method?
Anonymous web pop-ups and in-app surveys consistently produce the lowest response rates, often below 15% [1]. Mail surveys, despite being slower, tend to outperform digital methods significantly.
How many follow-up reminders should I send?
Research on web survey design suggests that two follow-up reminders (in addition to the initial invitation) increase completion rates meaningfully without triggering unsubscribes [2]. More than three reminders tends to generate more opt-outs than additional completions.
Should I make surveys anonymous?
It depends on the topic. For sensitive subjects like manager feedback, pay satisfaction, workplace concerns, anonymous surveys consistently produce more candid responses. For general training feedback or product reviews, anonymity matters less. If you choose anonymity, communicate it clearly in the invitation; respondents who aren't sure whether their answers are tracked often give more guarded replies anyway.
To put these into practice, the AhaSlides free survey creator lets you build, share, and analyze surveys in minutes — live in a session or sent as a standalone link. For the full survey creation process from objective-setting to analysis, see: How to create an online survey: the complete guide.
Sources
[1] Pointerpro. Average survey response rate benchmarks. https://pointerpro.com/blog/average-survey-response-rate/
[2] Strategies to improve response rates to web surveys: A literature review. International Journal of Nursing Studies, 2021. https://www.sciencedirect.com/science/article/abs/pii/S0020748921002054
[3] Edwards et al. (2009). Strategies to improve response rates to postal and electronic questionnaires. Cochrane Database of Systematic Reviews. See also: Springer Nature, 2019. https://link.springer.com/article/10.1186/s12874-019-0868-8
[4] DataReportal. Global social media statistics. https://datareportal.com/social-media-users (October 2024 data)
[5] Menold & Bogner (2016). Design of rating scales in questionnaires. GESIS Survey Guidelines. Referenced via: https://pmc.ncbi.nlm.nih.gov/articles/PMC4833473/