

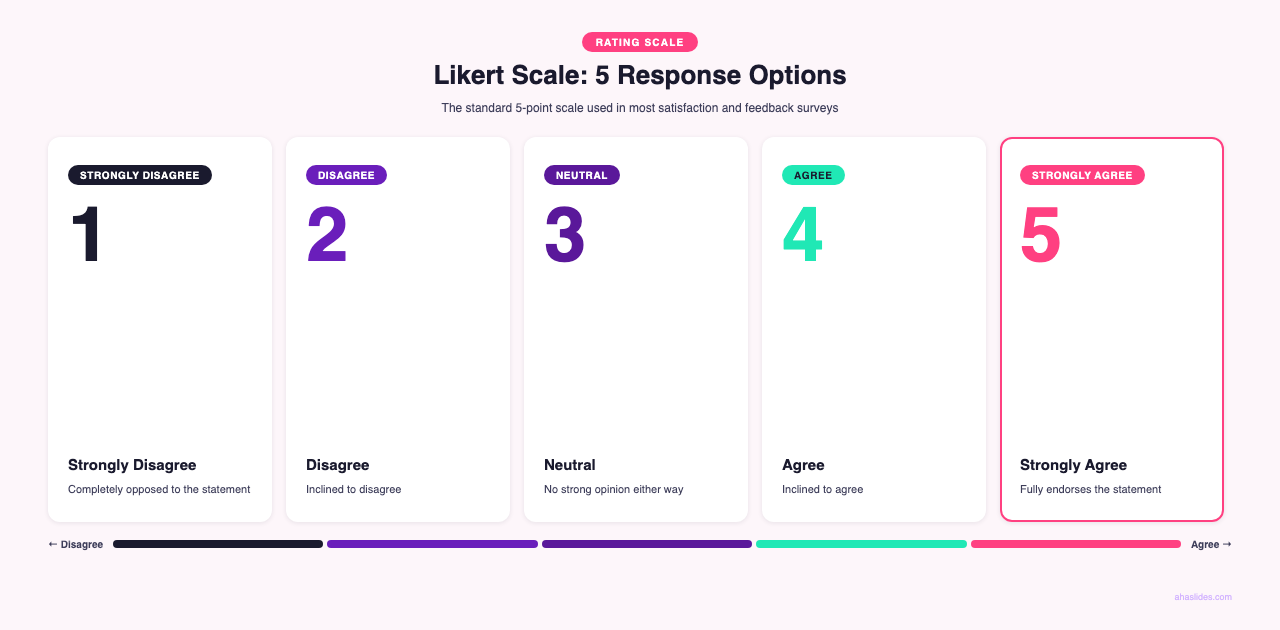
The best Likert scale for most surveys is a 5-point agreement scale (Strongly Disagree / Disagree / Neutral / Agree / Strongly Agree) for attitude and opinion questions, and a 5-point frequency scale (Never / Rarely / Sometimes / Often / Always) for behavior questions. A 5-point scale works best for most professional contexts because it is familiar, balances granularity with ease of response, and produces data that supports mean calculations; a 7-point scale for research contexts where fine-grained discrimination matters; a 4-point forced-choice scale (omitting the neutral midpoint) when you need to prevent fence-sitting on opinion items; and a 10-point scale for NPS-style loyalty measurement where the promoter/passive/detractor segmentation requires a wider spread. The most common mistake is mixing scale types within a single survey — use consistent anchor wording throughout for clean cross-question comparisons.
Building a training evaluation or employee survey is straightforward until you hit the question of which scale to use. Agreement? Satisfaction? Frequency? Five points or seven? This post collects 40+ Likert scale examples organized by scale type and use case, so you can stop second-guessing and start collecting data that actually tells you something. The history lesson comes later.
Rensis Likert developed this type of scale in his 1932 PhD thesis at Columbia University as a way to capture attitude data that could actually be analyzed statistically [1]. Nearly a century later, the format is still the most reliable way to measure how people think and feel, provided you pick the right version for the job.
Writing effective Likert statements
The scale format only matters if the statement itself is clear. Think of a poorly written Likert item like a blurry photograph: even a perfect 5-point scale cannot sharpen it. A few principles that hold across every use case:
One idea per statement. "The trainer was knowledgeable, and the materials were well-organized" is two questions in one. If someone agrees with one but not the other, you get a meaningless average. Split them.
Be specific, not general. "This training was good" tells you nothing actionable. "This training gave me practical techniques I can apply this week" tells you whether the content actually landed.
Avoid leading language. "Don't you agree that feedback sessions are valuable?" steers respondents toward agreement. Keep framing neutral: "Feedback sessions are a valuable use of my time."
Match tense to what you're measuring. For ongoing attitudes, use present tense: "I feel confident managing conflict in my team." For completed experiences, use past tense: "The onboarding process prepared me for my role."
Keep polarity consistent. If most statements are positively framed ("My manager supports my development"), avoid flipping a single item negative ("My manager does not give me enough feedback"). Respondents under time pressure often miss the negation and answer the wrong question. If you need to include reverse-scored items to check for consistency, make it deliberate and keep them to a minimum.
Agreement scales (Strongly disagree → Strongly agree)
Agreement scales are the most common Likert format. They work well when you want to measure how strongly someone endorses a specific statement.
3-point examples
"The instructions were easy to follow."
Use 3-point scales for quick pulse checks where nuance doesn't matter much: a single check-in question during a workshop break, for example. Fast to answer, easy to act on.
5-point examples
"The training content was relevant to my daily responsibilities."
Five points capture enough variation for meaningful analysis while staying simple enough that respondents actually complete the survey [2]. This is the default format for most professional use cases.
- "I understand how my work contributes to the organization's goals."
- "My manager communicates expectations clearly."
- "I have the resources I need to do my job effectively."
- "This course prepared me to apply the concepts in practice."
- "I feel comfortable raising concerns with my manager."
- "The pace of change in my organization is manageable."
7-point examples
"I am confident in my ability to use this software independently."
Research shows that 7-point scales provide better discriminative power than 5-point scales: they're more accurate at distinguishing between respondents who feel "somewhat satisfied" and those who are "very satisfied" [2]. Use them when you need to detect smaller shifts, such as tracking attitude change across multiple survey cycles.
- "I feel valued as a member of this team."
- "The onboarding process set clear expectations for my first 90 days."
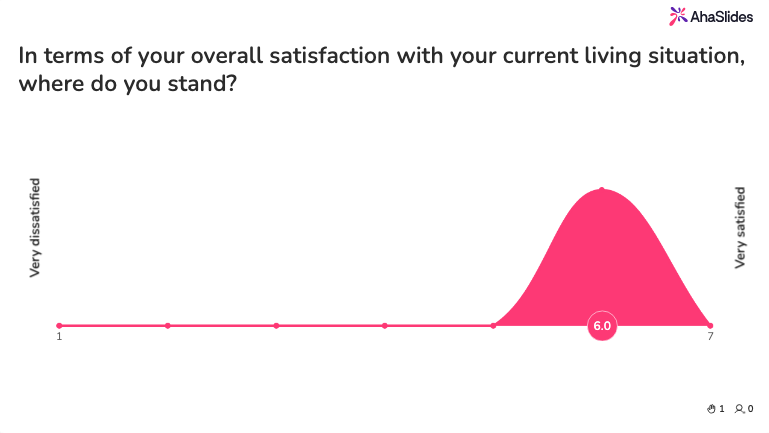
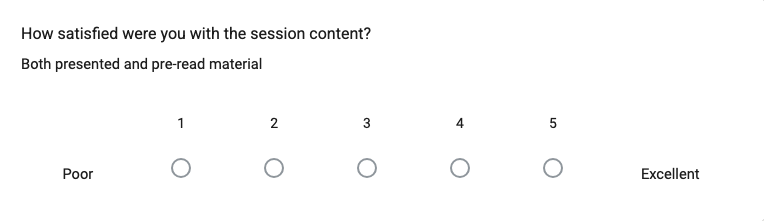
Satisfaction scales (Very dissatisfied → Very satisfied)
Satisfaction scales work best when you're evaluating an experience, service, or event, rather than measuring an opinion about a statement.
5-point examples
"How satisfied are you with the quality of today's keynote session?"
- "How satisfied are you with the support you received from our team?"
- "Rate your satisfaction with the venue facilities."
- "How satisfied are you with the professional development opportunities available to you?"
- "Rate your satisfaction with the work-life balance your role provides."
Frequency scales (Never → Always)
Frequency scales measure how often behaviors or events occur. They're useful for self-assessment, training transfer evaluations, and identifying gaps between intended and actual practice.
5-point examples
"I receive feedback from my manager on my work performance."
- "I feel overwhelmed by my workload."
- "I apply skills learned in training to my daily tasks."
- "Team meetings include time for open discussion and questions."
- "I use data to inform decisions in my role."
- "I collaborate with colleagues outside my immediate team."
- "I feel recognized for contributions beyond my core responsibilities."
Likelihood scales (Very unlikely → Very likely)
Likelihood scales measure intent or predict future behavior. The best-known application is the Net Promoter Score (NPS), introduced by Fred Reichheld in a 2003 Harvard Business Review article [3]. Note: NPS uses an 11-point (0–10) scale rather than the standard 5- or 7-point format, so its scoring method works differently from a typical Likert question.
5-point examples
"How likely are you to recommend this training program to a colleague?"
- "How likely are you to attend a future event by this organization?"
- "How likely are you to use this feature in your daily workflow?"
- "How likely are you to apply for an internal role within the next year?"
Quality scales (Very poor → Excellent)

Quality scales measure perceived output quality. They're well-suited to post-event evaluations, content reviews, and vendor assessments.
5-point examples
"How would you rate the quality of the presentation materials?"
- "Rate the quality of the food and beverages at the event."
- "How would you rate the audio/video quality of the virtual session?"
- "Rate the overall quality of your onboarding experience."
- "Rate the quality of the feedback you received from facilitators."
- "How would you rate the clarity of the session objectives?"
Importance scales (Not at all important → Extremely important)
Importance scales help you prioritize by finding out what actually matters to respondents, not just what you assume matters.
5-point examples
"How important is flexible scheduling to your job satisfaction?"
- "How important is career development support in your decision to stay with an employer?"
- "Rate the importance of real-time audience interaction during training sessions."
- "How important is anonymity when providing feedback about management?"
- "How important is recognition from leadership to your motivation at work?"
- "How important is cross-team collaboration to doing your job well?"
Choosing the right scale
The choice depends on what you're measuring and what you'll do with the data.
| Goal | Use this scale |
|---|---|
| Measure attitudes or opinions | Agreement scale |
| Evaluate an experience | Satisfaction scale |
| Track behavior patterns | Frequency scale |
| Predict future action | Likelihood scale |
| Assess output quality | Quality scale |
| Set priorities | Importance scale |
For most professional surveys, 5-point is the right default. It's easy to complete, produces data that's easy to visualize, and performs comparably to 7-point in most research settings [2]. Move to 7-point when you need finer resolution: comparing two similar training programs, tracking attitude shifts over time, or surfacing differences between employee groups that a 5-point scale might flatten.
Avoid this: mixing scale formats in the same survey without a clear reason. If respondents have to mentally shift gears between a 5-point satisfaction question and a 7-point agreement question, completion rates drop and response quality suffers. If you need multiple scale types in one survey, group all questions of the same format together rather than alternating between them.
Interpreting and acting on Likert data
Collecting responses is the easy part. The value comes from how you read and respond to the data.
Calculate means, not just counts. Most survey tools default to showing response distributions: how many people selected each option. That's useful for spotting outliers, but a mean score per item gives you a single number to track over time, which matters when comparing training cohorts, pre/post assessments, or quarterly engagement surveys.
Central tendency bias signals unclear questions. When a large share of responses cluster around the neutral midpoint, it often means the statement was ambiguous rather than that opinions are genuinely balanced. If you see 40–50% neutral on an item, revise the question before drawing conclusions from it.
Watch for acquiescence bias. Respondents have a documented tendency to agree with statements regardless of content, which inflates scores on positively framed items. This is one reason pairing a positively framed statement with a negatively framed equivalent can be useful, though it adds survey length and requires careful analysis.
Segment before you summarize. A company-wide average on "I feel engaged in my work" hides everything useful. Split the data by department, tenure, manager, or location, and the patterns become actionable. A 4.2 average across the organization tells you almost nothing. A 2.8 in one team and a 5.0 in another tells you where to look next.
Close the loop. Sharing aggregated results back with respondents, even briefly, increases response rates in future surveys and signals that the data is being taken seriously. For training evaluations, a five-minute debrief showing the group's aggregated responses is often more valuable than a report that lands in a shared drive a week later.
Running Likert surveys with AhaSlides
Designing the question is only part of the job. Getting people to respond, and doing something useful with the results, is where most surveys fall short.
AhaSlides is an all-in-one platform combining polls, rating scales, Q&A, word clouds, and quizzes, so you don't need a separate survey tool bolted onto your session. You can set the number of scale points, customize the labels, and run surveys live during a training or meeting, or send them asynchronously afterward. Results appear in real time, so trainers and facilitators can review responses with the group while the session is still fresh, rather than compiling a report that lands in inboxes a week later when nobody remembers what happened.
For training evaluations and team feedback in particular, that immediacy changes the dynamic. When people see their own responses reflected back as a group, the conversation after the data is often more valuable than the data itself.
A common setup for L&D teams: run a 5-point agreement scale at the end of each training module to check whether the content landed, then compare scores across cohorts over time to identify which modules consistently underperform. The same approach works for onboarding: a short frequency or satisfaction survey at the 30-day and 90-day marks gives HR a repeatable signal on where new hires lose momentum, without needing a full engagement survey every quarter.
To put these into practice, the AhaSlides free survey creator lets you build, share, and analyze surveys in minutes — live in a session or sent as a standalone link. For the full survey creation process from objective-setting to analysis, see: How to create an online survey: the complete guide.
Frequently asked questions
What is the best Likert scale for surveys?
The best Likert scale for most surveys is a 5-point scale: Strongly Disagree / Disagree / Neutral / Agree / Strongly Agree for attitude questions, and Never / Rarely / Sometimes / Often / Always for frequency questions. Use a 7-point scale when fine-grained discrimination matters (academic or clinical research); a 4-point forced-choice scale to eliminate fence-sitting; and a 10-point scale for NPS measurement. Keep the same scale type throughout a single survey for valid cross-question comparisons.
Should you include a neutral midpoint in a Likert scale?
Include a neutral midpoint when genuine neutrality is a valid and meaningful response — such as in attitude surveys where some respondents truly have no opinion. Omit it (use a 4- or 6-point scale) when you need respondents to lean one way or the other, such as in employee engagement surveys where fence-sitting masks real sentiment and prevents action.
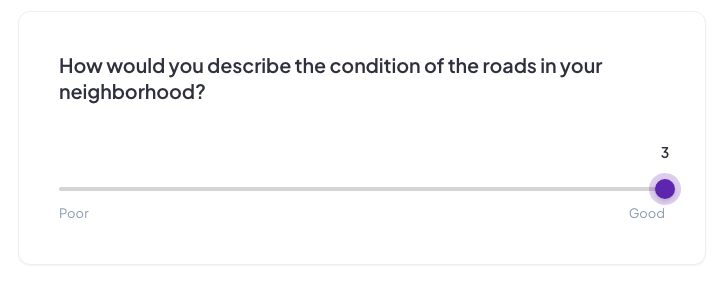
What is the difference between a Likert scale and a rating scale?
A Likert scale measures agreement or frequency using labeled anchor points (Strongly Agree to Strongly Disagree). A rating scale measures magnitude using numbers (1–5 or 1–10) with or without labels. Likert scales are better for measuring attitudes, perceptions, and engagement; rating scales for satisfaction, quality assessment, and NPS-style loyalty measurement where numerical output is needed.
How many Likert scale questions should a survey have?
A survey can include up to 15–20 Likert items before cognitive fatigue degrades data quality, but 8–12 items is the sweet spot for most professional surveys. For pulse checks, limit to 3–5 Likert items. Group related items under a shared subheading to reduce cognitive load and improve completion rates on longer instruments.
Sources
[1] Likert, R. (1932). A technique for the measurement of attitudes. Archives of Psychology, 22(140), 1–55. Original PDF
[2] Jotform. 5-point vs 7-point Likert scale: Which is better? https://www.jotform.com/blog/7-point-likert-scale/. Summarizes academic research on scale reliability and discriminative power.
[3] Reichheld, F. (December 2003). "The one number you need to grow." Harvard Business Review. ResearchGate