
AI-powered insights for more impactful presentations.

Stop guessing and get clear data. Measure performance, spot learning gaps, and keep track of engagement — with AI-powered presentation data you can act on.
Check out Reports
AhaSlides' report and analytics feature

Measure what matters most

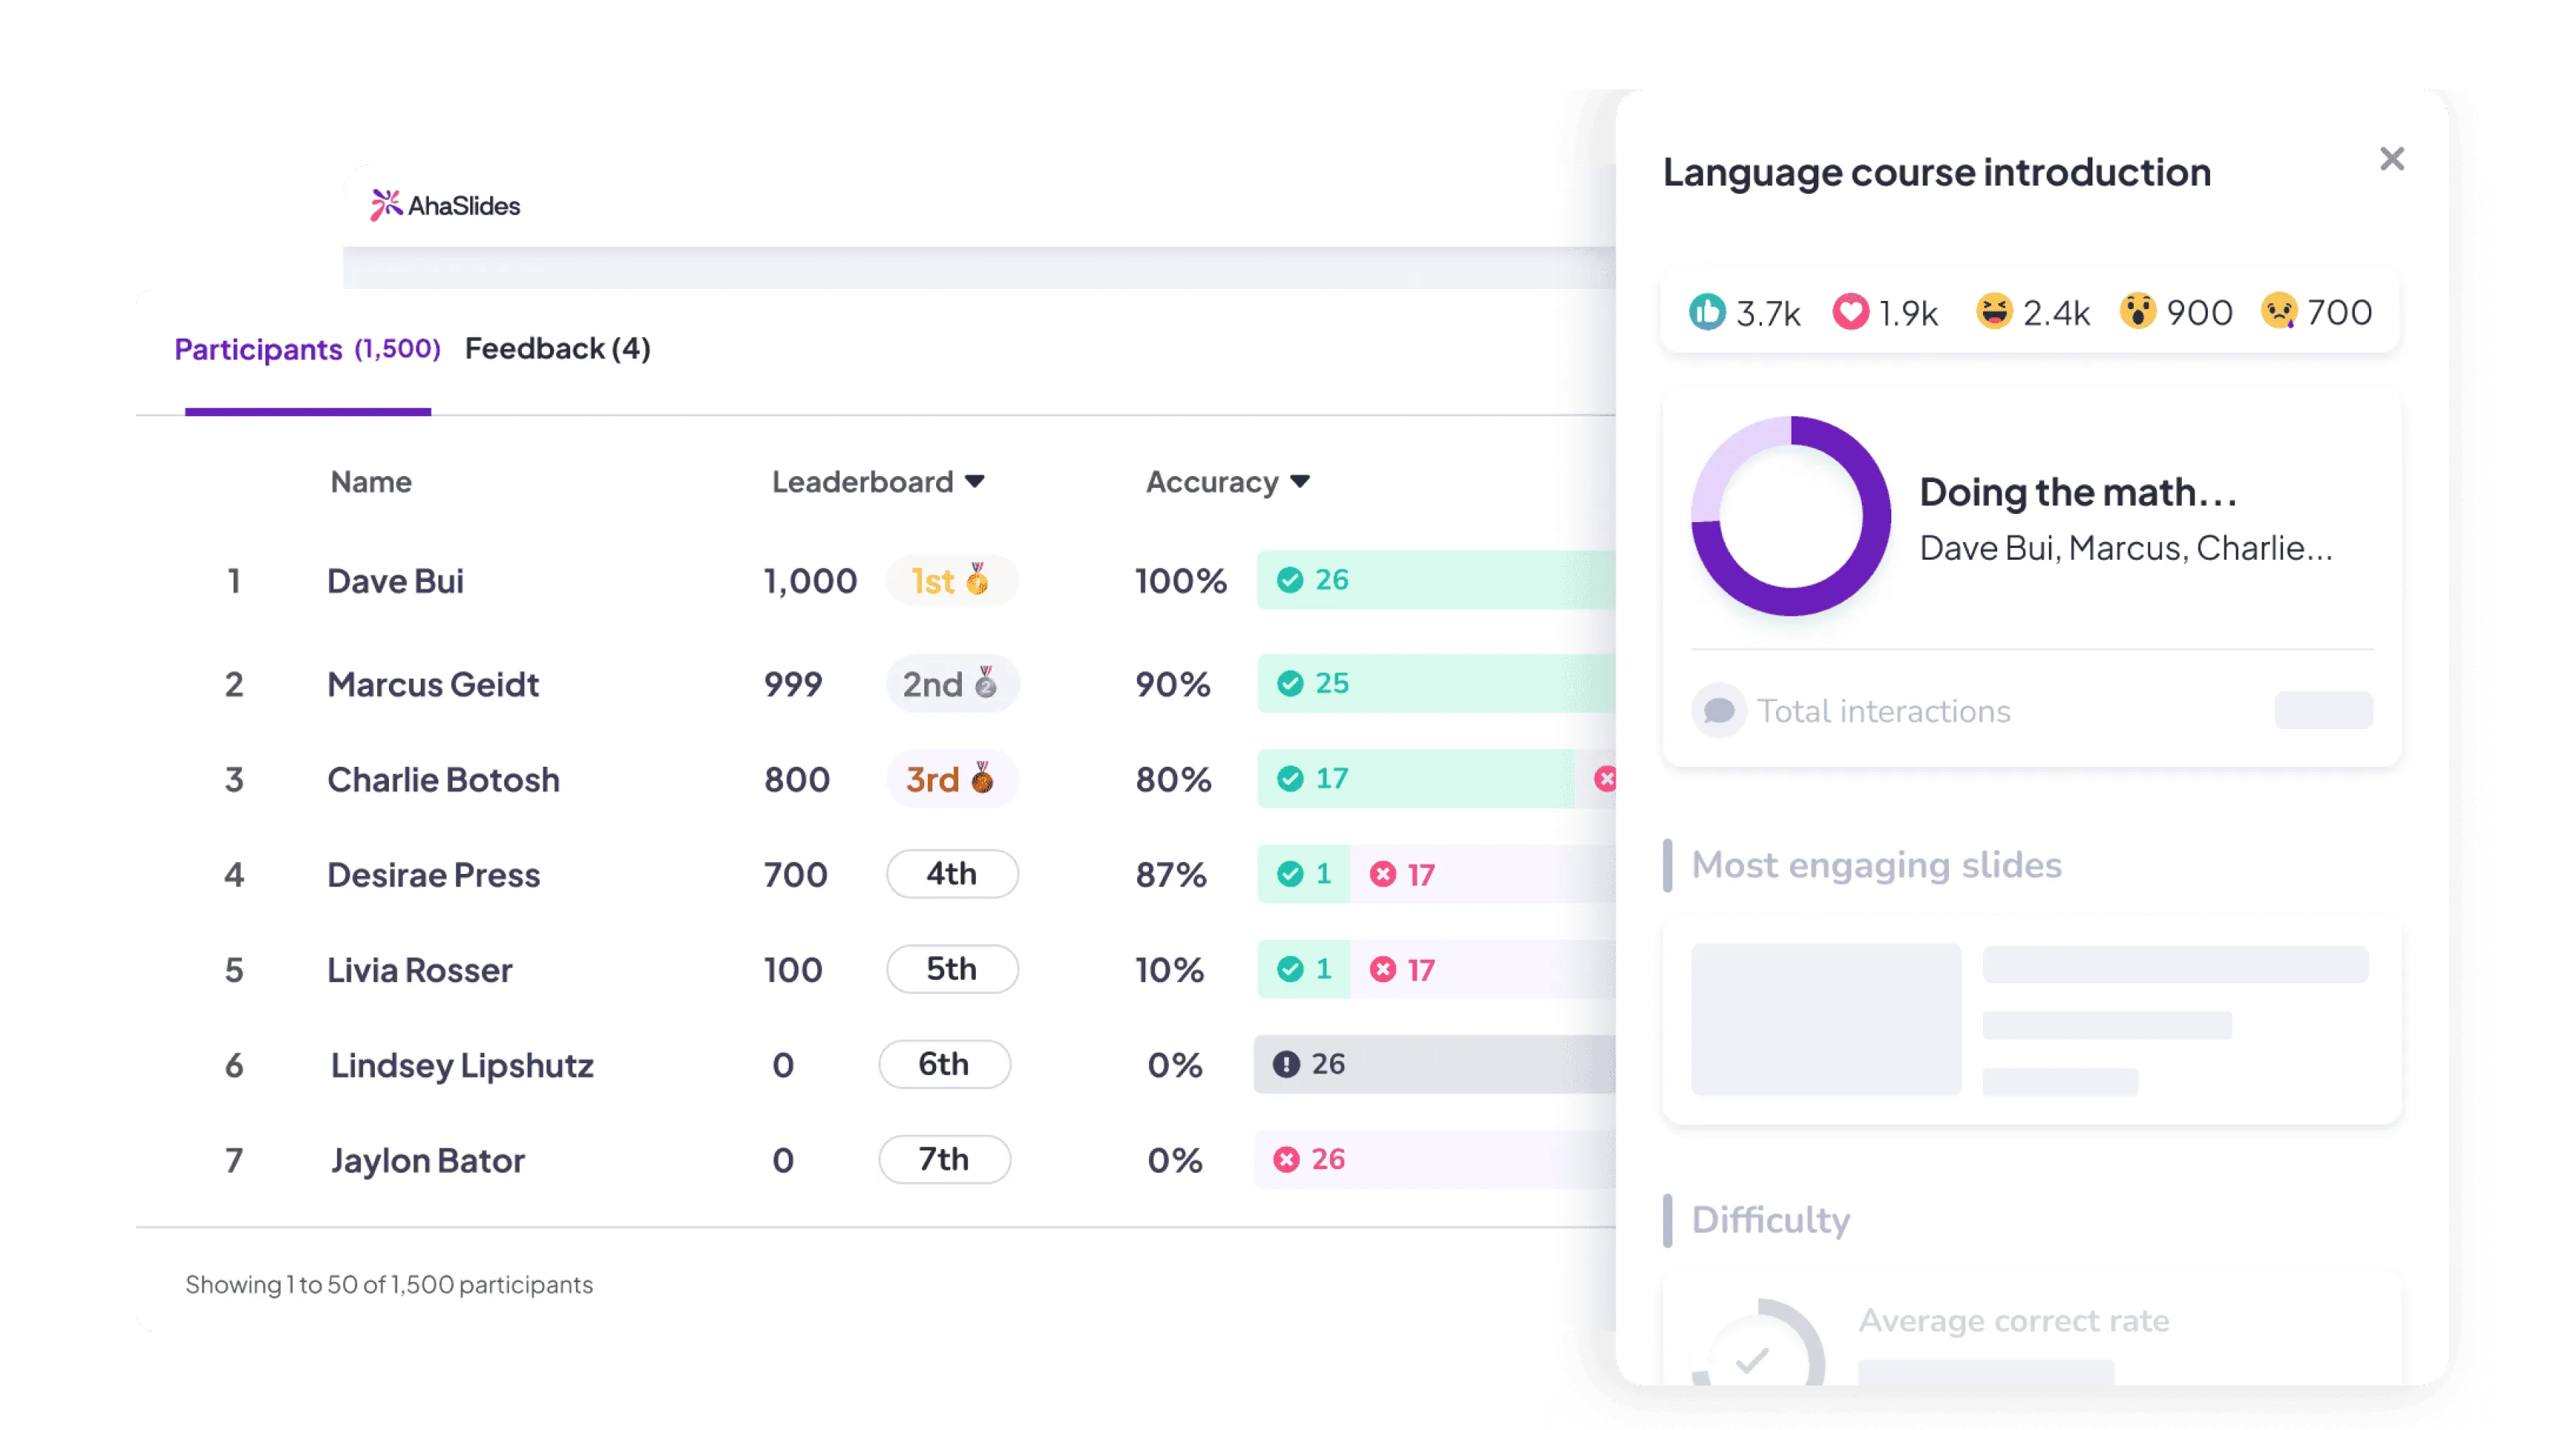
Participant reports

Get detailed individual performance data — track scores, participation rates, and response patterns for each participant

Deep session analysis

Dive into overall session metrics — see engagement levels, question output, and what resonates most with your audience

Export your slides

Export presentation slides with all submitted responses included. Perfect for record-keeping and sharing session outcomes with your team

Custom designs

Download detailed data in Excel for in-depth analysis and reporting needs
Check out Reports
AhaSlides' detailed report with participant info

Built for continuous improvement

Track participant performance

Assess understanding and measure learning outcomes for classroom and workplace training

Identify engagement gaps

Spot exactly where you're losing audience attention and what needs to be improved

Stakeholder reports

Professional reports to share with colleagues, managers, and other stakeholders

History records and data

Keep comprehensive records of all sessions for long-term tracking and analysis

Make your work so much easier

Intuitive dashboards

Clean, easy-to-read post-session report that makes sense instantly

Smart AI grouping

Encapsulate the overall mood and opinions of your audience from word clouds and open-ended polls

Accurate data

Reliable metrics you can trust for decision making
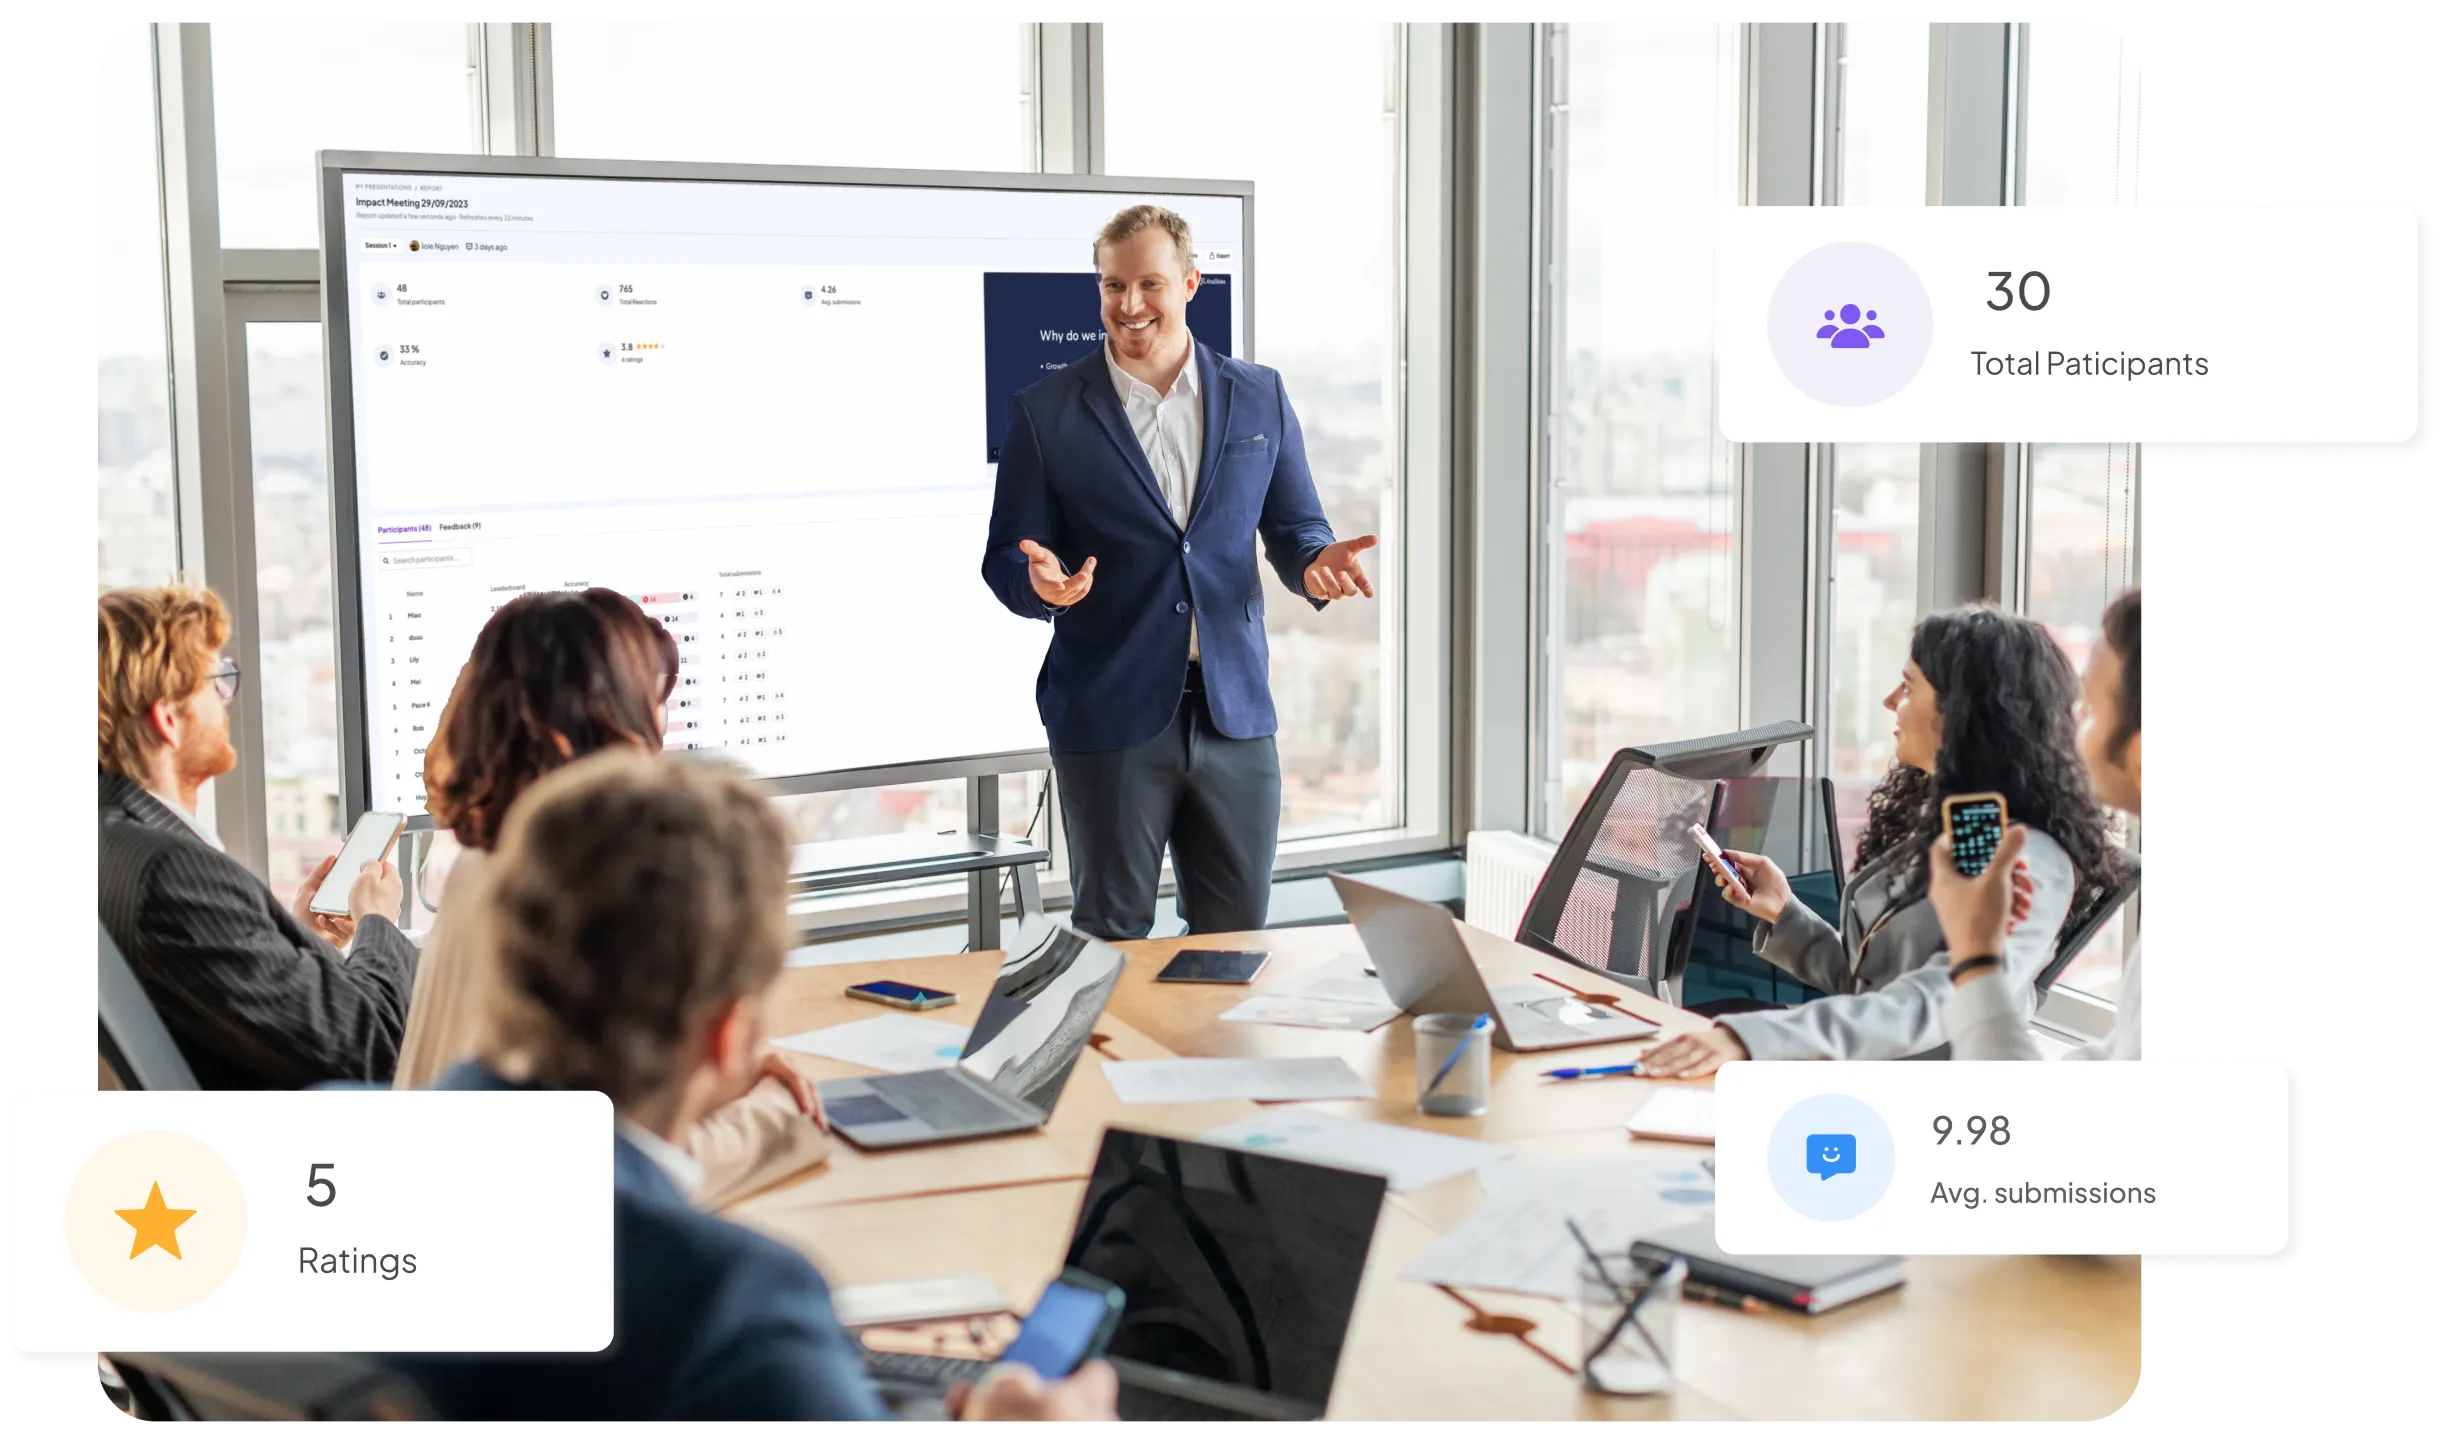
AhaSlides reporting feature making the presenter's work easier

What our users say

Hear from the teachers, trainers and teams who use it every day.

"Instead of a passive audience, people become active participants in the discussion. This is especially valuable when discussing topics such as career paths, women in STEM, and academic experiences — where hearing many voices enriches the conversation."

Ana Laura Pérez Martínez
Professor, Faculty of Engineering, UNAM

"They're using their phones to answer — not to check emails. They don't even realize how much they're reinforcing learning because they're trying to win."

Dave Choura
Managing partner, Elite Training Innovations, LLC

"It was key that the tool was prepared for large crowds and allowed the simultaneous connection of a considerable number of people, something that AhaSlides offered us with total reliability."

Paula Angulo
Marketing Manager at Casademont Zaragoza

Frequently Asked Questions

What kind of data can I collect?
The reporting system is designed to give you both the big picture (overall engagement and performance) and granular details (what each individual participant contributed)
Where can I see the report?
There are two ways to find your presentation report on AhaSlides.
1. On the editor, click the 'Report' tab in the top right toolbar and it will take you to the 'Participant Report'
2. On the My Presentations dashboard, hover over your presentation and click the purple 'Report' button, this will also take you to the 'Presentation Report'
Can I generate reports based on team performance and not individual performance?
Yes, you can. When your data is exported to Excel, it will contain all the information you need.
Do you have any tips and tricks for gaining insights from the report?
You can save time analysing the report by getting an AI like ChatGPT or Gemini to read the file! Our report can be exported to Excel, which makes it easy for AI to collect and analyse the information.

Stop guessing and start knowing with instant presentation data

Get started free
© 2026 AhaSlides Pte Ltd