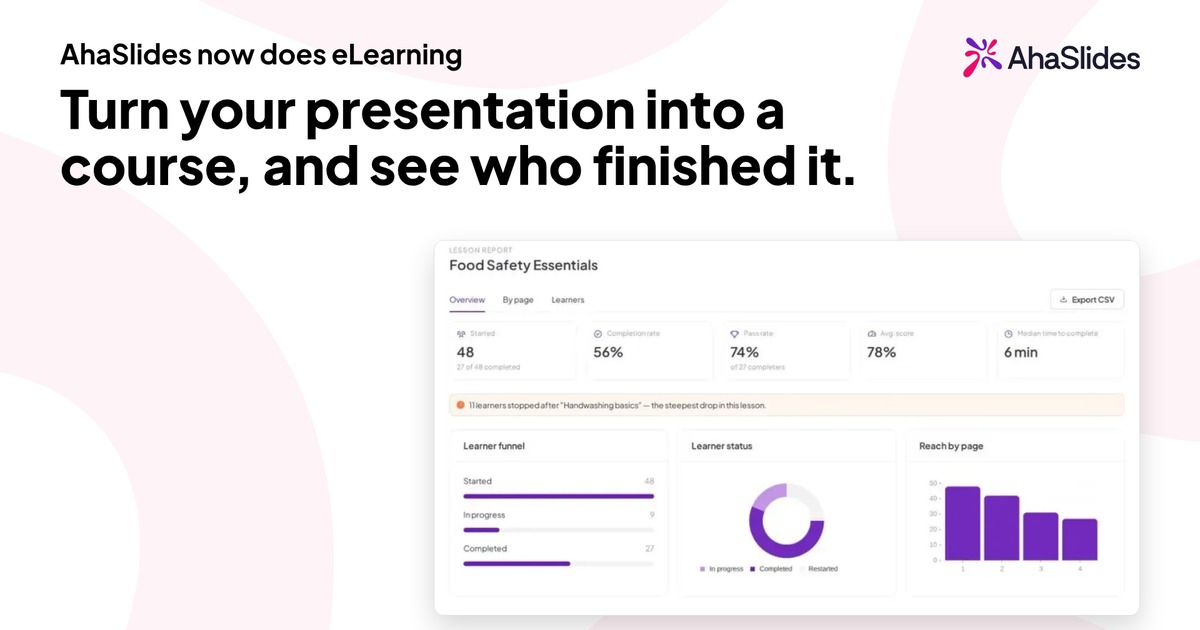



A training manager opens the learning dashboard on Monday. Completion is 96 per cent. Average satisfaction is 4.5 out of 5. Then a team lead asks the awkward question: "Are people handling these customer escalations any differently?" The dashboard cannot answer. It records that the course was finished, not that anything changed at work.
This is the gap most training metrics leave open. Completion tells you who reached the end. It does not tell you who learned the skill, who used it, or whether the business moved. This guide gives you a hierarchy of evidence and a one-page measurement plan you can fill in for any programme, without pretending every course needs a full causal ROI study.
The opening scenario above is illustrative, not a documented customer case.
Quick facts
| Question | Short answer |
|---|---|
| What is wrong with completion rates? | They measure participation, not learning or on-the-job change |
| What should you measure instead? | Learning against objectives, transfer to the job, then operational outcomes with context |
| Does every course need ROI analysis? | No. Match the depth of evidence to the decision being made |
| What goes in a measurement plan? | Outcome, measure, source, denominator, timing and owner |
1. Define the decision the data should support
Before choosing a metric, name the decision it will inform. Three common ones need different evidence:
- Improve the programme. You need to know where learners struggled, so item-level and task-level results matter more than a pass mark.
- Confirm readiness. You need evidence that a person can perform a defined task to an agreed standard, usually through observation or a scored task.
- Assess a rollout. You need to compare groups or periods, so consistent measures, denominators and timing matter most.
If you cannot say which decision the data supports, you will collect everything and conclude little. A short test: if the result came back poor, what would you do differently? If the answer is "nothing", the metric is not earning its place.
2. Measure learning against objectives
Start from the job task, not the course content. Write the objective as something a person does ("triage an escalated complaint using the agreed criteria"), then design the assessment to match. The Carnegie Mellon Eberly Center makes the underlying point plainly: assessments, objectives and instructional activities should reinforce one another, and teaching analytical skills while assessing only factual recall leaves learners practising the wrong thing (Eberly Center guidance on aligning assessments, objectives and instructional strategies).
In practice, that gives you three design choices:
- Set a baseline. Assess the task before training, or use a brief diagnostic, so you know where each learner starts. Without a baseline, a good post-training score could simply reflect prior skill.
- Use a matched follow-up. The later assessment should test the same task and standard, using a new case rather than the one practised. Repeating the identical items rewards memory of the answers.
- Keep satisfaction separate. Learner reactions help you improve the experience, but the US Centers for Disease Control and Prevention (CDC) is explicit in its training evaluation guidance that learner satisfaction does not determine whether a training is effective (CDC, evaluate training: measuring effectiveness). Report it, but never as a stand-in for learning.
A simple three-point rubric helps here. Score each criterion 0 (absent or unsupported), 1 (partial, with relevant omissions) or 2 (complete and justified), and define critical errors separately so an overall score cannot hide a serious failure. Adapt the criteria with a subject specialist; a rubric you wrote yourself is a starting point, not a validated standard.
3. Assess transfer after work exposure
Learning something in a course and doing it at work are different events. The CDC guidance separates learning assessment from learning transfer evaluation, which asks how successfully a learner applies what they learned once back in the workplace.
Transfer evidence needs time. Schedule a follow-up after the learner has had a genuine opportunity to use the skill, which might be two weeks for a daily task and several months for a rare one. Then gather evidence in one or more of these ways:
- Observation or work-sample review against the same rubric used in training.
- Manager or peer input using specific, behaviour-based questions rather than "did they improve?".
- System evidence where the task leaves a trace, such as a completed form or a logged case.
Record barriers as carefully as results. A learner who can do the task in training but does not do it at work may lack the tools, authority, time or manager support. Those constraints can remain even after task performance improves in the classroom, and they are the findings most likely to change your next decision. Ask "what stopped you applying this?" and categorise the answers.
4. Interpret operational outcomes with context
Operational measures such as error rates, handling times or resolution rates matter because they are what the organisation cares about. They are also the easiest to over-read.
Three habits keep you honest:
- Use a comparable rate. Counts mislead when volumes change. Compare rates against a stated denominator: errors per hundred cases, not errors in total.
- List alternative explanations. Seasonality, a new tool, a staffing change or a policy update can all move the same number in the same quarter. Write them down before you look at the result.
- Say what kind of claim it is. If trained staff show a better rate than untrained staff, that is an observed association. A causal claim needs a design that rules out the alternatives, such as a comparison group or a staggered rollout. Most programmes do not need that level of rigour, and it is fine to say so plainly: "outcomes moved in the direction we hoped; here is what else changed."
Avoid promising a return on investment from training alone. Report what you observed, the context, and the limits.
5. Build a practical measurement plan
Put the pieces into one table per programme. Each row is a question the data must answer.
| Field | What to write | Why it matters |
|---|---|---|
| Outcome | The change you expect, in observable terms | Stops vague goals |
| Measure | The specific metric or rubric score | Makes it testable |
| Source | Where the data comes from | Shows whether it exists and is trustworthy |
| Denominator | Who or what the measure is out of | Prevents misleading raw counts |
| Timing | When it is collected | Separates learning from transfer |
| Owner | The named person responsible | Makes it happen |
Worked example (illustrative, no results shown)
Imagine a programme to help customer support staff handle escalated complaints. The decision: confirm readiness before agents take escalations without a buddy.
| Outcome | Measure | Source | Denominator | Timing | Owner |
|---|---|---|---|---|---|
| Agents triage an escalation using the agreed criteria | Rubric score (0 to 2 per criterion, no critical errors) on a new case | Scored case practice | Agents completing the programme | End of programme, against a pre-training baseline | Training lead |
| Agents apply the triage steps on live cases | Rubric score on sampled real escalations | Quality review sample | Sampled escalations per agent | Four to six weeks after first live escalations | Team lead |
| Barriers to applying the steps are known | Categorised reasons from a short follow-up | Agent follow-up check | Agents who handled an escalation | Same follow-up window | Training lead |
| Escalation outcomes are tracked in context | Reopened-case rate, with concurrent changes noted | Case system | Escalations closed in the period | Quarterly, compared with the prior period | Operations analyst |
Notice what is absent: no promised percentage improvement, and no claim that training alone drives the final row. The plan commits you to collecting honest evidence, not to a particular answer.
Where interactive and adaptive delivery fit
Measurement is easier when the learning itself generates evidence. Interactive activities, such as scored case questions, scenario polls and short knowledge checks, give you per-learner and per-item data during training, and adaptive learning can route people according to how they perform. Blended designs that move between live sessions and self-paced study let you take a diagnostic on your own time, practise a case live with feedback, and complete a follow-up review asynchronously.
These capabilities support the evidence in rows one and two of your plan. They do not replace the transfer and outcome rows, which depend on what happens at work. Check which specific reporting and authoring features you need against a demonstration before you commit to a design, and treat any external tool or integration as separate from the core workflow until you have seen it working.
Try it with your own programme
Fill in the six-field plan for one programme you run now, starting with the decision it should support.
To see how the learning evidence in your plan could be captured in a live or self-paced session, explore AhaSlides.
Frequently asked questions
What are training effectiveness metrics?
They are the measures you use to judge whether training achieved its purpose. A useful set covers learning against objectives, transfer to the job, and operational outcomes read in context, rather than completion and satisfaction alone.
Is a completion rate a useful metric?
It is useful for tracking participation and spotting access problems. It cannot show that anyone learned or applied a skill, so pair it with an assessment and a follow-up.
How long after training should I measure transfer?
Long enough for learners to have a real chance to use the skill. A daily task might need a couple of weeks, while a rare task needs longer. Set the window in your plan before training starts.
Do I need to prove ROI for every course?
No. Match the evidence to the decision. Many programmes are well served by learning and transfer evidence plus operational outcomes reported with context. Reserve causal analysis for high-stakes or high-cost programmes where the design allows it.