



How do you put a number on a feeling? A customer might call your brand 'fine', but is that warm, cold, modern or tired? The semantic differential scale gives you a structured way to find out. Respondents place a concept between two opposite adjectives, such as boring and interesting, and the pattern of their answers shows what the concept means to them.
This guide covers what the scale is, how it differs from a Likert scale, six common variations, five worked examples, how to build and analyse one, and how to run it live with a rating scale in AhaSlides.
What is the semantic differential scale?
A semantic differential scale is a rating format that measures the connotative meaning a person attaches to a concept, brand, product or experience. Psychologist Charles E. Osgood and his colleagues Suci and Tannenbaum developed it in the 1950s and published the method in The Measurement of Meaning (1957).
Each item is a pair of bipolar adjectives (opposites), such as good-bad or effective-ineffective, with a line of points between them. The classic format uses seven points. The respondent marks the point that best matches their view, and the distance from the midpoint shows how strongly they feel.
Osgood's factor analyses found that most adjective pairs load on three underlying dimensions, now often called EPA:
- Evaluation: good-bad, pleasant-unpleasant, valuable-worthless.
- Potency: strong-weak, large-small, powerful-powerless.
- Activity: active-passive, fast-slow, lively-calm.
That is why the scale is more than a satisfaction score. It tells you whether people see something as good, whether they see it as strong, and whether they see it as lively.
Semantic differential scale vs Likert scale
Both formats appear in surveys, but they ask different questions. A Likert scale asks how far someone agrees with a statement. A semantic differential asks where a concept sits between two opposite ideas.
| Feature | Semantic differential | Likert scale |
|---|---|---|
| Question it answers | What does this concept mean to you? | How far do you agree with this statement? |
| Structure | Bipolar adjective pair, usually 5 to 7 points | Agreement statement, usually 5 or 7 points |
| Anchors | Opposite words (boring - interesting) | Agreement labels (strongly disagree - strongly agree) |
| Best for | Brand image, product perception, attitudes and emotions | Satisfaction, opinions, beliefs about specific statements |
| Output | A profile of several dimensions | A level of agreement per statement |
| Watch out for | Poor adjective choices and non-opposite pairs | Acquiescence bias and central tendency |
If you already run Likert surveys and want a richer picture of how people perceive something, adding a few semantic differential items is a low-effort upgrade. For Likert examples, see our Likert scale examples.
6 types of semantic differential scale
1. Standard semantic differential scale
The classic form: bipolar adjectives at either end of a 5 to 7 point scale. Use it in psychology, marketing and social science to measure how people perceive objects, ideas or brands.
2. Visual analogue scale (VAS)
A close relative that uses a continuous line or slider instead of discrete points. It is common in clinical research for pain or anxiety, where fine gradations matter.
3. Multi-item semantic differential scale
Several adjective pairs describe different dimensions of one concept. The averaged scores give a more reliable picture than a single item, which suits brand tracking and user experience studies.
4. Cross-cultural semantic differential scale
Adjectives are adapted, and translations checked, so they carry the same meaning across cultures. Osgood and colleagues ran cross-cultural studies that compared affective meaning across many language communities. Use this type for international research.
5. Emotion-specific semantic differential scale
Pairs target a particular feeling, such as joyful-gloomy or calm-anxious. It suits advertising tests and media studies where emotional reaction is the point.
6. Domain-specific semantic differential scale
Adjective pairs are written for one field, such as healthcare, education or software, so the wording matches how people in that field talk.
5 examples of semantic differential scales
1. Brand perception
Goal: see how consumers perceive a brand.
Pairs: innovative-outdated, trustworthy-unreliable, high quality-low quality.
Use: compare the profile before and after a rebrand, or against a competitor.
2. Customer satisfaction
Goal: measure how customers feel after a purchase.
Pairs: satisfied-dissatisfied, valuable-worthless, pleased-annoyed.
Use: add to post-purchase surveys to spot the dimension that drags the score down.
3. User experience research
Goal: assess how a website or app feels to use.
Pairs: user-friendly-confusing, attractive-unattractive, modern-dated.
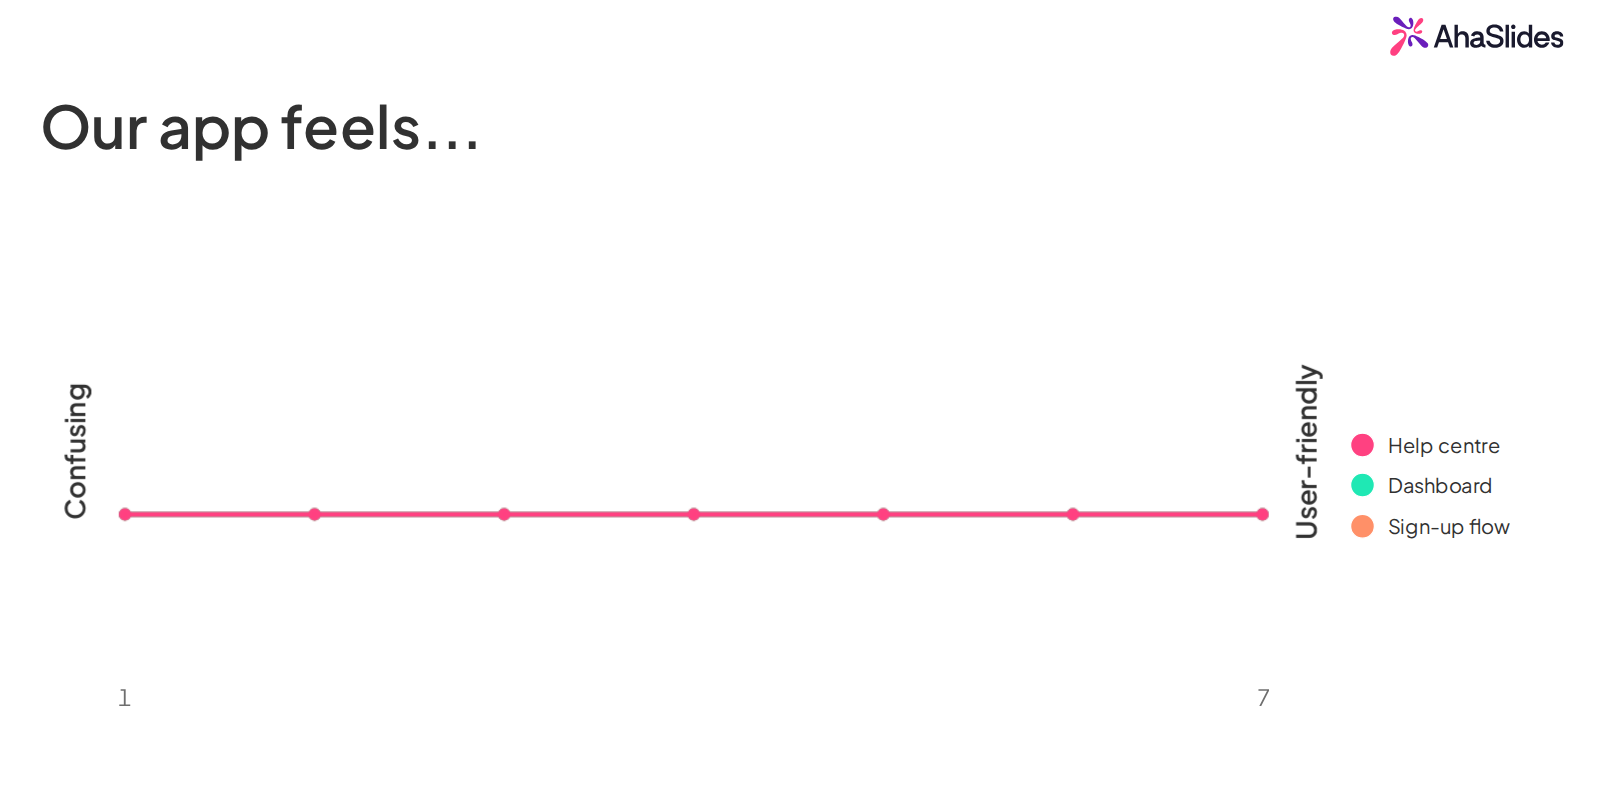
Use: rate individual screens or flows, as in the AhaSlides example below.
4. Employee engagement
Goal: understand employee engagement and how people feel about their workplace.
Pairs: engaged-disengaged, motivated-unmotivated, valued-undervalued.
Use: include in pulse surveys and compare teams.
5. Educational research
Goal: evaluate how students feel about a course or teaching method.
Pairs: interesting-boring, informative-uninformative, inspiring-discouraging.
Use: check whether a new teaching method changes perception, not just test scores.
How to build a semantic differential scale
- Define the concept. Rate one clear thing: your brand, a product, a training programme. Vague concepts give vague data.
- Choose true opposites. Easy-difficult works. Easy-expensive does not, because the words are not opposites.
- Cover several dimensions. Include pairs for evaluation, potency and activity so you see more than a good-bad verdict.
- Pick 5 or 7 points. Seven gives more nuance; five is faster on a phone. Keep it the same across all items.
- Mix the direction. Put the positive word on the left for some pairs and the right for others, so respondents read each pair instead of ticking down one column.
- Keep it short. Eight to twelve pairs per concept is usually enough.
- Pilot it. Test with a handful of people and drop any pair they find confusing.
How to analyse the results
Score each point from 1 to 7 (or -3 to +3) and calculate the average per adjective pair. Plot the averages as a profile line, one point per pair, so you can see at a glance where the concept sits and compare it with a rival or an earlier survey.
Researchers usually treat the scores as interval data, which allows means and standard deviations. Treating rating scales as interval data is a debated practice, though Norman (2010) argues parametric methods are robust with this kind of data. For small samples, or when you want to be cautious, report medians and distributions as well.
Run a semantic differential in AhaSlides
You can run this kind of question live or as a self-paced survey with the AhaSlides rating scale. Set the left label to one adjective and the right label to its opposite, choose a 1 to 7 range, then list the things you want rated. Participants answer on their phones and the averages appear as a line you can show on screen.
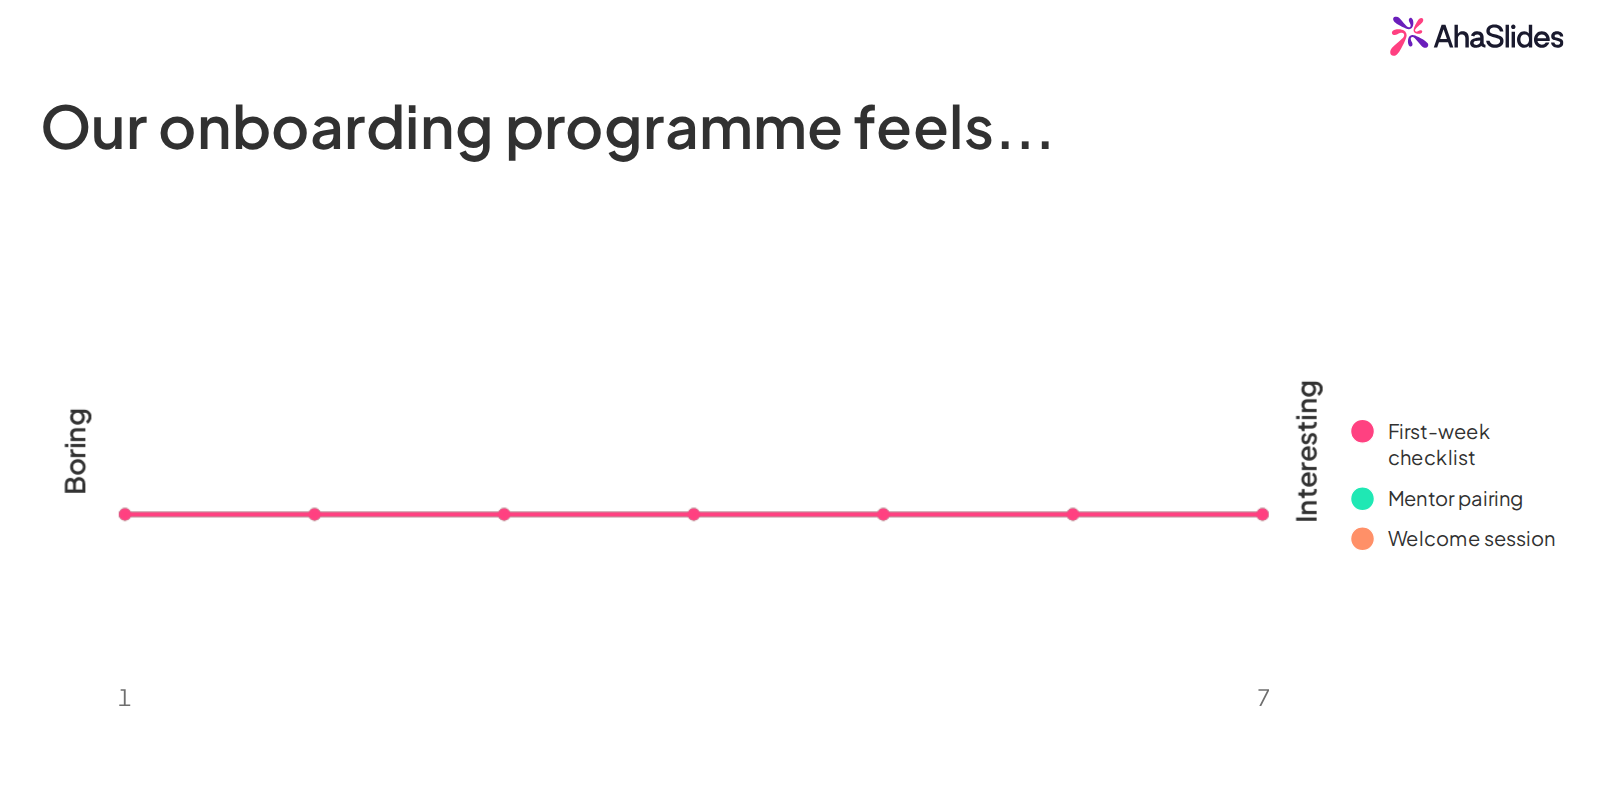
Add one slide per adjective pair, or reuse the same slide for several concepts. Browse the template library for ready-made survey and feedback decks.
Bottom line
The semantic differential scale shows what a concept means to people, not just whether they like it. Choose true opposites, cover evaluation, potency and activity, and compare average profiles over time or against alternatives. Pair it with a Likert scale when you also need agreement with specific statements.
Sources
- Osgood, C. E., Suci, G. J. and Tannenbaum, P. H. (1957). The Measurement of Meaning. University of Illinois Press
- Norman, G. (2010). Likert scales, levels of measurement and the laws of statistics. Advances in Health Sciences Education, 15, 625-632
- Drive Research: What is a semantic differential scale?
- QuestionPro: Semantic differential scale