When it comes to tackling organizational issues, a picture is worth a thousand words. Enter the Ishikawa diagram, a visual masterpiece that simplifies the art of problem-solving.
In this post, we'll explore Ishikawa diagram example, and explore how to use this type of diagram. Say goodbye to confusion and hello to a streamlined approach for addressing the root causes that might be hindering your organization's success.
Table Of Contents
- What Is A Ishikawa Diagram?
- How To Make A Ishikawa Diagram
- Ishikawa Diagram Example
- Key Takeaways
- FAQs
What Is A Ishikawa Diagram?
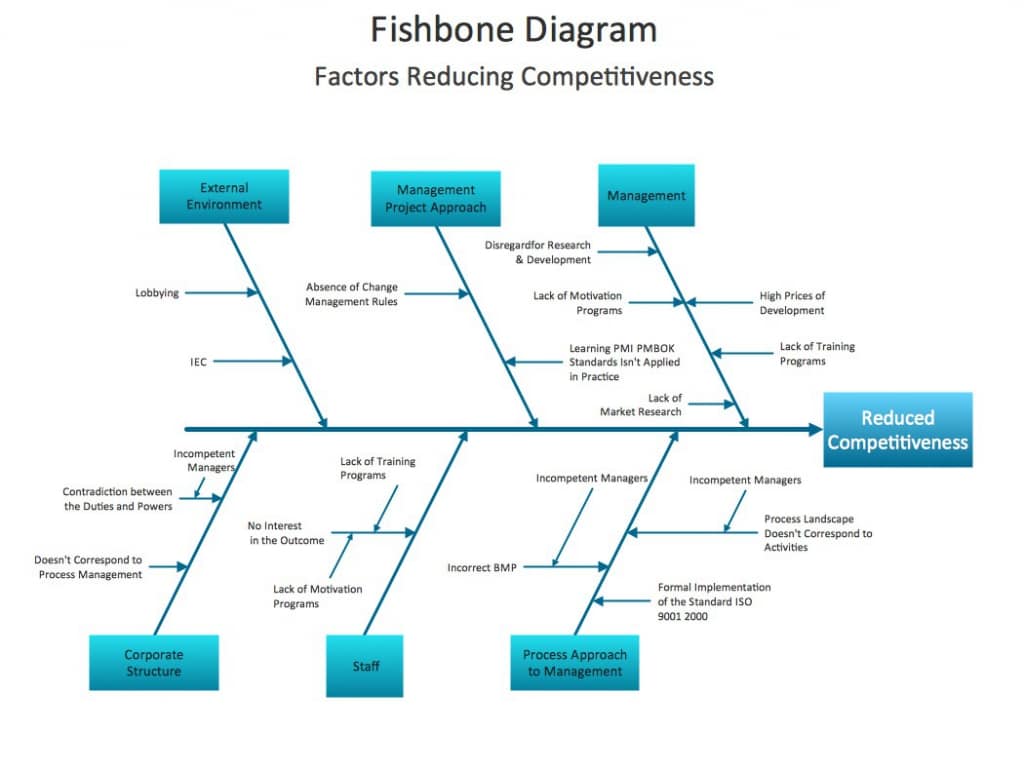
An Ishikawa diagram, also known as a fishbone diagram or cause-and-effect diagram, is a visual representation used to analyze and display the potential causes of a specific problem or effect. This diagram is named after Professor Kaoru Ishikawa, a Japanese quality control statistician, who popularized its use in the 1960s.
The structure of an Ishikawa diagram resembles the skeleton of a fish, with the "head" representing the problem or effect and the "bones" branching off to depict different categories of potential causes. These categories typically include:
- Methods: Processes or procedures that may contribute to the problem.
- Machines: Equipment and technology involved in the process.
- Materials: Raw materials, substances, or components involved.
- Manpower: Human factors such as skills, training, and workload.
- Measurement: The methods used to evaluate and assess the process.
- Environment: The external factors or conditions that may influence the problem.
To create an Ishikawa diagram, a team or individual gathers relevant information and brainstorms potential causes within each category. This method helps identify the root causes of a problem, fostering a deeper understanding of the issues at hand.
The visual nature of the diagram makes it an effective communication tool within teams and organizations, promoting collaborative problem-solving efforts.
Ishikawa diagrams are widely used in quality management, process improvement, and problem-solving initiatives across various industries.
How To Make A Ishikawa Diagram
Creating an Ishikawa diagram involves a simple process of identifying and categorizing potential causes for a specific problem or effect. Here's a concise step-by-step guide:
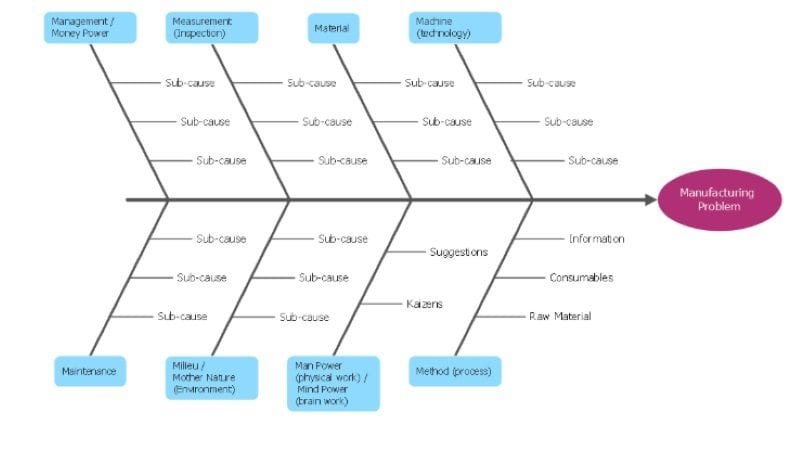
- Define the Problem: Clearly articulate the problem you aim to analyze – this becomes the "head" of your fishbone diagram.
- Draw the Fishbone: Create a horizontal line across the center of the page, extending diagonal lines for main categories (Methods, Machines, Materials, Manpower, Measurement, Environment).
- Brainstorm Causes: Identify processes or procedures (Methods), equipment (Machines), raw materials (Materials), human factors (Manpower), evaluation methods (Measurement), and external factors (Environment).
- Identify Sub-Causes: Extend lines under each main category to outline specific causes within each.
- Analyze and Prioritize Causes: Discuss and prioritize identified causes based on their significance and relevance to the problem.
- Document Causes: Write down identified causes on the appropriate branches to maintain clarity.
- Review and Refine: Collaboratively review the diagram, making adjustments for accuracy and relevance.
- Use Software Tools (Optional): Consider digital tools for a more polished Ishikawa diagram.
- Communicate and Implement Solutions: Share the diagram for discussion and decision-making, using insights gained to develop targeted solutions.
Following these steps enables the creation of a valuable Ishikawa diagram for effective problem analysis and resolution in your team or organization.
Ishikawa Diagram Example
Looking for a Ishikawa diagram example? Here are examples of how an Ishikawa or fishbone diagram is made in various industries.
Fishbone Diagram Example Cause and Effect
Here is a Ishikawa diagram example - Cause and Effect
Problem/Effect: High website bounce rate
Causes:
- Methods: Unintuitive navigation, confusing checkout process, poorly structured content
- Materials: Low-quality images and videos, outdated brand messaging, lack of visual appeal
- Manpower: Insufficient UX testing, lack of content optimization, inadequate web analytics skills
- Measurement: No defined website KPIs, lack of A/B testing, minimal customer feedback
- Environment: Overly promotional messaging, too many popups, irrelevant recommendations
- Machines: Web hosting downtime, broken links, lack of mobile optimization
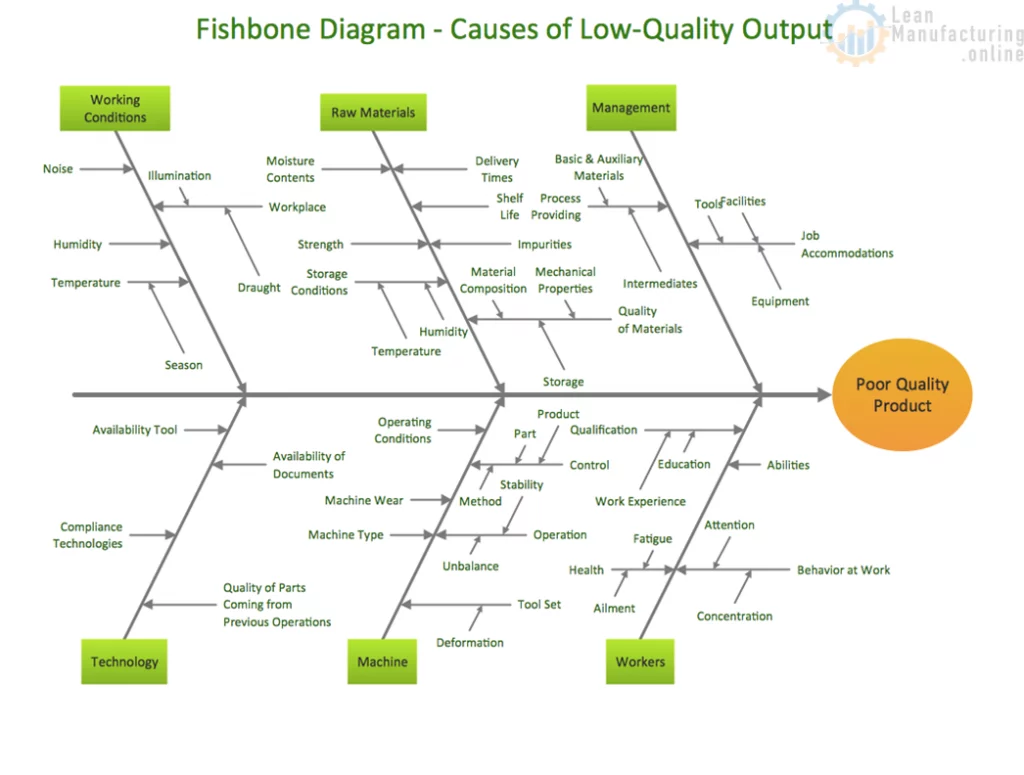
Fishbone Diagram Example Manufacturing
Here is a Ishikawa diagram example for manufacturing
Problem/Effect: High rate of product defects
Causes:
- Methods: Outdated manufacturing processes, insufficient training on new equipment, inefficient layout of workstations
- Machines: Equipment failure, lack of preventive maintenance, improper machine settings
- Materials: Defective raw materials, variability in material properties, improper material storage
- Manpower: Insufficient operator skills, high turnover, inadequate supervision
- Measurement: Inaccurate measurements, unclear specifications
- Environment: Excessive vibration, temperature extremes, poor lighting
Ishikawa Diagram 5 Whys
Problem/Effect: Low patient satisfaction scores
Causes:
- Methods: Long wait times for appointments, inadequate time spent with patients, poor bedside manner
- Materials: Uncomfortable waiting room chairs, outdated patient education pamphlets
- Manpower: High clinician turnover, inadequate training on new system
- Measurement: Inaccurate patient pain assessments, lack of feedback surveys, minimal data collection
- Environment: Cluttered and dull facility, uncomfortable clinic rooms, lack of privacy
- Machines: Outdated clinic equipment
Fishbone Diagram Example Healthcare
Here is a Ishikawa diagram example for healthcare
Problem/Effect: Increase in hospital-acquired infections
Causes:
- Methods: Inadequate hand-washing protocols, poorly defined procedures
- Materials: Expired medications, defective medical devices, contaminated supplies
- Manpower: Insufficient staff training, high workload, poor communication
- Measurement: Inaccurate diagnostic tests, improper use of equipment, unclear health records
- Environment: Uncleaned surfaces, presence of pathogens, poor air quality
- Machines: Medical equipment failure, lack of preventive maintenance, outdated technology
Fishbone Diagram Example for Business
Here is a Ishikawa diagram example for business
Problem/Effect: Declining customer satisfaction
Causes:
- Methods: Poorly defined processes, inadequate training, inefficient workflows
- Materials: Low-quality inputs, variability in supplies, improper storage
- Manpower: Insufficient staff skills, inadequate supervision, high turnover
- Measurement: Unclear objectives, inaccurate data, poorly tracked metrics
- Environment: Excessive office noise, poor ergonomics, outdated tools
- Machines: IT system downtime, software bugs, lack of support
Fishbone Diagram Environment Example
Here is a Ishikawa diagram example for the environment
Problem/Effect: Increase in industrial waste contamination
Causes:
- Methods: Inefficient waste disposal process, improper recycling protocols
- Materials: Toxic raw materials, non-degradable plastics, hazardous chemicals
- Manpower: Lack of sustainability training, resistance to change, insufficient oversight
- Measurement: Inaccurate emissions data, unmonitored waste streams, unclear benchmarks
- Environment: Extreme weather events, poor air/water quality, habitat destruction
- Machines: Equipment leaks, outdated technology with high emissions
Fishbone Diagram Example for Food Industry
Here is a Ishikawa diagram example for the food industry
Problem/Effect: Increase in foodborne illnesses
Causes:
- Materials: Contaminated raw ingredients, improper ingredient storage, expired ingredients
- Methods: Unsafe food prep protocols, inadequate employee training, poorly designed workflows
- Manpower: Insufficient food safety knowledge, lack of accountability, high turnover
- Measurement: Inaccurate expiration dates, improper calibration of food safety equipment
- Environment: Unsanitary facilities, presence of pests, poor temperature control
- Machines: Equipment failure, lack of preventive maintenance, improper machine settings
Key Takeaways
The Ishikawa diagram is a potent tool for unraveling the complexities of issues by categorizing potential factors.
To enrich the collaborative experience of creating Ishikawa diagrams, platforms like AhaSlides prove invaluable. AhaSlides supports real-time teamwork, enabling seamless idea contribution. Its interactive features, including live polling and Q&A sessions, inject dynamism and engagement into the brainstorming process.
FAQs
What is the application of Ishikawa diagram with example?
Application of Ishikawa Diagram with Example:
Application: Problem analysis and root cause identification.
Example: Analyzing production delays in a manufacturing plant.
How do you write an Ishikawa diagram?
- Define the Problem: Clearly articulate the issue.
- Draw the "Fishbone:" Create main categories (Methods, Machines, Materials, Manpower, Measurement, Environment).
- Brainstorm Causes: Identify specific causes within each category.
- Identify Sub-Causes: Extend lines for detailed causes under each main category.
- Analyze and Prioritize: Discuss and prioritize identified causes.
What are the 6 elements of fishbone diagram?
6 Elements of Fishbone Diagram: Methods, Machines, Materials, Manpower, Measurement, Environment.
Ref: Tech Target | Scribbr