You have run the training, the workshop wrapped up, and now you need to know whether it actually landed. A pile of vague comments will not tell you. A well-designed Likert scale questionnaire will.
Likert scale questionnaires use rating scales to capture how strongly someone feels about a statement — not just whether they agree or disagree, but by how much. Think of a Likert scale as the difference between asking someone "did you like dinner?" and "how much did you enjoy each course?" One gives you a thumbs up; the other tells you to ditch the soup.
Whether you are a trainer evaluating workshop effectiveness, an HR professional measuring employee engagement, or an educator assessing learning experiences, well-crafted Likert scales reveal the nuances that simple yes/no questions miss. This guide provides practical examples you can adapt immediately, plus essential design principles to create questionnaires that deliver reliable, meaningful data.
What are Likert scale questionnaires?
A Likert scale questionnaire uses rating scales to measure attitudes, opinions, or behaviors. First introduced by psychologist Rensis Likert in 1932, these scales present statements that respondents rate along a continuum — typically from complete disagreement to complete agreement, or from very dissatisfied to very satisfied.
The genius lies in capturing intensity, not just position. Rather than forcing binary choices, Likert scales measure how strongly someone feels, providing nuanced data that reveals patterns and trends.
Types of Likert scales
5-point vs. 7-point scales: The 5-point scale (the most common) balances simplicity with useful detail. A 7-point scale offers more granularity but increases respondent effort. A 2008 study by Dawes in the International Journal of Market Research found that 5-point and 7-point Likert scales produce statistically comparable results for most practitioner purposes [add citation number], so favor 5-point scales unless subtle differences matter critically.
Odd vs. even scales: Odd-numbered scales (5-point, 7-point) include a neutral midpoint — useful when genuine neutrality exists. Even-numbered scales (4-point, 6-point) force respondents to lean positive or negative, eliminating fence-sitting. Use even scales only when you genuinely need to push for a position.
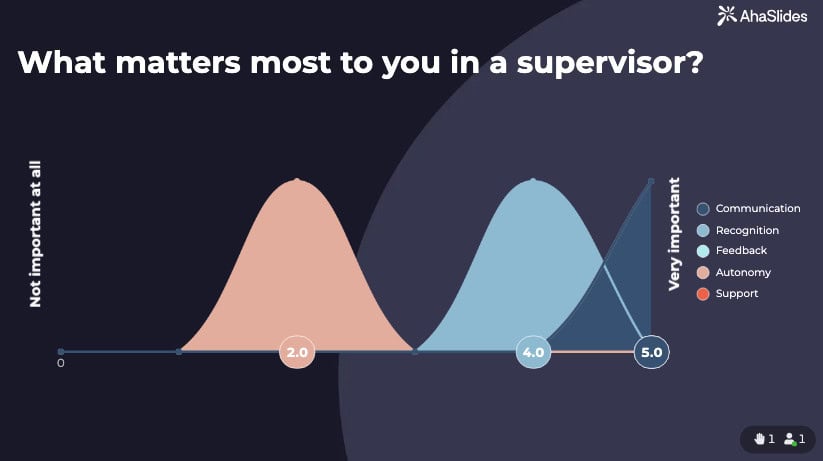
Bipolar vs. unipolar: Bipolar scales measure two opposite extremes (strongly disagree to strongly agree). Unipolar scales measure one dimension from zero to maximum (not at all satisfied to extremely satisfied). Choose based on what you are measuring — opposing viewpoints need bipolar, intensity of one quality needs unipolar.
7 sample Likert scale questionnaires
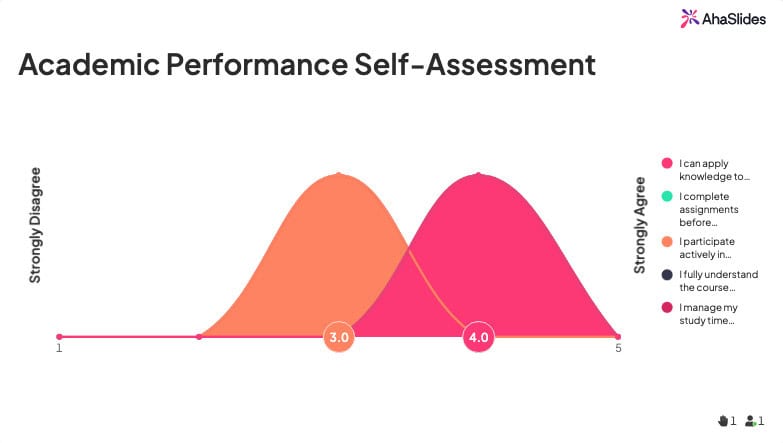
1. Academic performance self-assessment
Track student progress and identify areas needing support with this self-evaluation questionnaire.
Scoring: Assign 1-5 points per response. Total score interpretation: 20-25 (Excellent), 15-19 (Good, room for improvement), Below 15 (Needs significant attention).
2. Online learning experience
Evaluate virtual training or education effectiveness to improve remote learning delivery.
3. Customer satisfaction survey
Measure customer sentiment about products, services, or experiences to identify improvement opportunities.
4. Employee engagement & wellbeing
Understand workplace satisfaction and identify factors affecting productivity and morale.
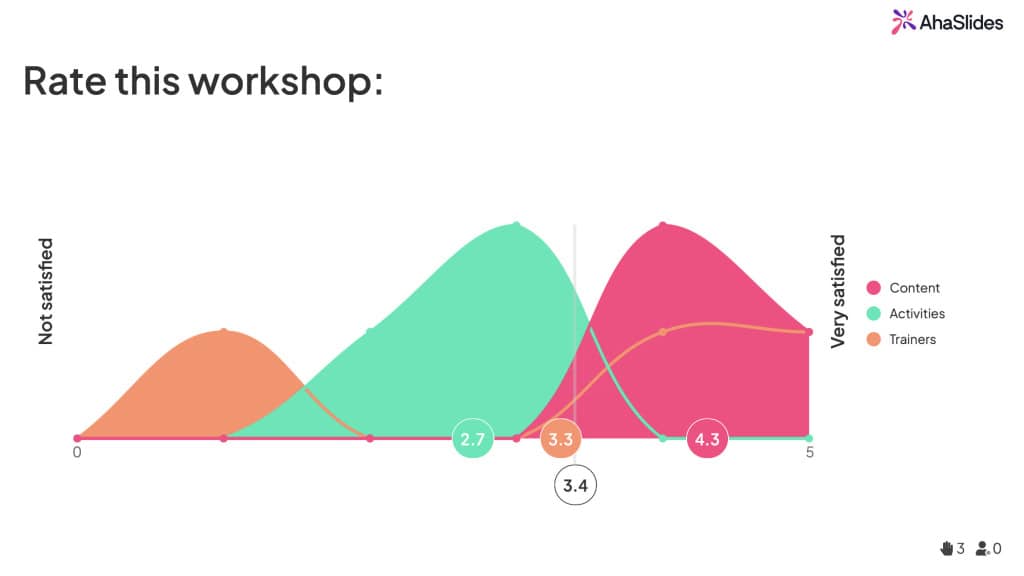
5. Workshop & training effectiveness
Gather feedback on professional development sessions to improve future training delivery.
6. Product feedback & feature evaluation
Collect user opinions on product features, usability, and satisfaction to guide development.
7. Event & conference feedback
Assess attendee satisfaction with events to improve future programs and experiences.
Common mistakes to avoid

Using too many scale points. More than 7 points overwhelms respondents without adding meaningful data. Stick with 5 points for most purposes.
Inconsistent labelling. Switching scale labels between questions forces respondents to constantly recalibrate. Use consistent language throughout.
Double-barreled questions. Combining multiple concepts in one statement ("The training was informative and entertaining") prevents clear interpretation. Separate into distinct statements.
Leading language. Phrases like "Don't you agree..." or "Obviously..." bias responses. Use neutral phrasing.
Survey fatigue. Too many questions reduce data quality as respondents rush through. Prioritize essential questions.
Analyzing Likert scale data
Likert scales produce ordinal data — responses have meaningful order but the distance between points is not necessarily equal. This affects proper analysis.
Use median and mode, not just mean. The middle response (median) and most common response (mode) provide more reliable insights than averages for ordinal data.
Examine frequency distributions. Look at how responses cluster. If 70% select "agree" or "strongly agree," that is a clear pattern regardless of the exact average.
Present data visually. Bar charts showing response percentages communicate results more clearly than statistical summaries.
Look for patterns across items. Multiple low ratings on related statements reveal systemic issues worth addressing.
Consider response bias. Social desirability bias may inflate positive responses on sensitive topics. Anonymous surveys reduce this effect.
How to create Likert scale questionnaires with AhaSlides
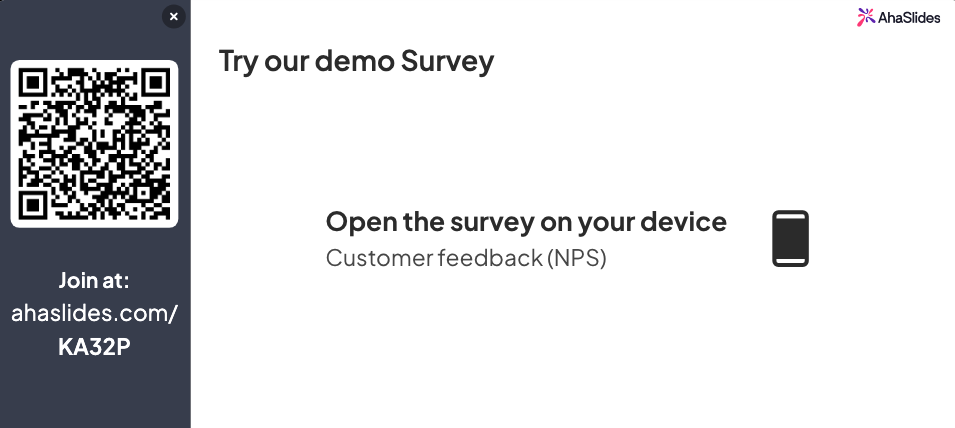
AhaSlides lets you build Likert scale questionnaires for live or asynchronous feedback. Its Survey feature supports custom labels, and results display in real time as participants respond from their devices. Because AhaSlides handles polls, rating scales, open-ended questions, and word clouds in a single presentation, your whole feedback session runs in one place without switching tools. For live events and training sessions, this is particularly powerful: you can present results immediately, discuss them with the group, and capture both quantitative ratings and qualitative follow-up responses in a single session.
Step 1: Sign up for a free AhaSlides account.
Step 2: Create a new survey under the Survey section.
Step 3: Publish the Survey.
Step 4: Create your presentation with AhaSlides, and choose the Survey slide type.
Step 5: Choose the published Survey you have created.
When presenting in front of a live audience, your audience will be able to see and complete the questions in the Survey.
The platform's real-time response display works excellently for workshop feedback, training evaluations, and team pulse checks where immediate visibility drives discussion.