


Most strategic plans fail not because the goals are wrong, but because the plan never connects to day-to-day decisions. Research suggests that 60 to 90% of strategic plans never fully launch [1], and only 27% of employees can access their organization's strategic plan at all [2].
Good strategic planning requires two things: a clear understanding of where you are and where you're going, and tools that help you track the gap between the two. This guide covers both — with practical examples and 11 tools your team can apply.
What is a strategic plan?
A strategic plan is a document that outlines an organization's long-term goals, the strategies to achieve them, and the metrics used to measure progress. It typically covers a 3 to 5-year horizon and connects the organization's mission and vision to specific, measurable objectives.
A strategic plan is not an annual budget, an operational plan, or a list of projects — those serve the strategy; they don't define it.
The core components of a solid strategic plan:
- Mission — why the organization exists
- Vision — what success looks like in 3 to 5 years
- Goals — the broad outcomes the organization is working toward
- Objectives — specific, measurable milestones under each goal
- Initiatives — the projects and actions that drive the objectives
- Metrics — how progress is tracked
Strategic plan examples by type

Strategic plans vary widely by industry and organizational stage. Here are examples of how different organizations structure them.
Example 1: Product company — OKR-based plan
Mission: Help remote teams collaborate without friction.
Vision: Become the default async communication tool for distributed companies by 2028.
Objective 1: Grow monthly active users by 40% in the next 12 months.
- Key Result 1: Launch mobile app for iOS and Android by Q2.
- Key Result 2: Reduce onboarding drop-off rate from 34% to 18%.
- Key Result 3: Achieve NPS of 45 or above by Q4.
Objective 2: Expand into enterprise segment.
- Key Result 1: Close 10 enterprise contracts ($50K+) by year-end.
- Key Result 2: Complete SOC 2 Type II certification by Q3.
Example 2: Nonprofit — mission-aligned plan
Mission: Increase access to early childhood education in underserved communities.
Vision: Every child in our county has access to quality pre-K by 2027.
Strategic Goal 1: Expand program capacity by 30% over two years.
- Objective: Open two new program sites by December 2025.
- Metric: Number of children enrolled month-over-month.
Strategic Goal 2: Diversify funding to reduce reliance on a single grant source.
- Objective: Secure 3 new foundation grants and grow individual donor base by 25%.
- Metric: % of revenue from sources other than primary grant.
Example 3: Mid-size B2B company — Balanced Scorecard plan
Using the Balanced Scorecard framework (see Tool 5 below), this company structures its plan across four perspectives:
- Financial: Grow gross revenue by 20% and improve operating margin from 12% to 16%.
- Customer: Reduce churn from 8% to 5% and increase customer lifetime value by 15%.
- Internal process: Reduce average sales cycle length from 90 to 60 days.
- Learning and growth: Complete cross-functional leadership training for all department heads.
11 tools for effective strategic planning
These are the frameworks most organizations use when building and executing strategic plans. They are not mutually exclusive — most teams use two or three together.
1. SWOT analysis
SWOT stands for Strengths, Weaknesses, Opportunities, and Threats. It is a structured way to assess both internal factors (strengths and weaknesses) and external factors (opportunities and threats) that affect the organization's strategic position.
The framework traces to Albert Humphrey and his team at the Stanford Research Institute in the 1960s, who were studying why corporate planning consistently failed [3].
Use SWOT at the start of your planning cycle to make sure the plan is grounded in reality, not just the leadership team's preferences.
2. PEST analysis
PEST stands for Political, Economic, Social, and Technological factors. It is a macro-environmental scanning framework that helps organizations understand the external conditions that could affect their strategy.
Francis Aguilar, a Harvard Business School professor, introduced the framework in his 1967 book Scanning the Business Environment [4]. The extended version, PESTLE, adds Legal and Environmental factors.
PEST works well before entering a new market or when conditions are shifting rapidly — regulatory changes, inflation, demographic shifts. It deepens the external side of your SWOT analysis.
3. OKRs (Objectives and Key Results)
OKRs break strategy into a hierarchy of ambitious goals (Objectives) paired with measurable outcomes that define what success looks like (Key Results). The framework was developed by Andy Grove at Intel in the 1970s and documented in his 1983 book High Output Management [5]. John Doerr brought the method to Google in 1999, where it became a core part of how the company scaled.
OKRs separate aspirational direction from measurable accountability: the Objective tells everyone where you're heading; the Key Results tell you whether you got there.
OKRs are typically set quarterly at the team level and annually at the company level, with a review cycle that surfaces progress and problems early.
4. SMART goals
SMART is a criteria framework for writing objectives that are Specific, Measurable, Achievable, Relevant, and Time-bound. The acronym is widely attributed to a 1981 article by George Doran in Management Review [6].
Where OKRs tend toward ambitious stretch targets, SMART goals are designed for operational clarity. They answer the question: does this objective mean the same thing to everyone reading it? If it doesn't, it is not SMART.
Use SMART criteria to check every objective in your strategic plan before you finalize it.
5. Balanced Scorecard
The Balanced Scorecard is a performance management framework that translates strategy into four measurement perspectives: Financial, Customer, Internal Process, and Learning and Growth. Robert Kaplan and David Norton introduced it in a 1992 Harvard Business Review article, "The Balanced Scorecard: Measures That Drive Performance" [7].
The core insight is that financial metrics alone are lagging indicators — they tell you what happened, not why. Tracking leading indicators across customers, processes, and people development lets organizations catch execution problems before they show up in the financials.
It is particularly useful for mature organizations where aligning multiple departments to common strategic priorities is a persistent challenge.
6. Blue Ocean Strategy
Blue Ocean Strategy is a framework for creating new, uncontested market space rather than competing in existing, crowded markets (the "red ocean"). W. Chan Kim and Renée Mauborgne, professors at INSEAD, developed the framework and published it in their 2005 book Blue Ocean Strategy: How to Create Uncontested Market Space and Make the Competition Irrelevant [8].
The framework uses a Strategy Canvas — a visual tool for mapping how your offer compares to competitors across key competitive factors — and the Four Actions Framework, which asks which factors should be eliminated, reduced, raised, or created.
Blue Ocean Strategy is most relevant when your team is evaluating whether to compete harder in an existing category or move into an adjacent space with less competitive pressure.
7. Porter's Five Forces
Porter's Five Forces is a competitive analysis framework developed by Michael Porter of Harvard Business School, introduced in his 1979 Harvard Business Review article "How Competitive Forces Shape Strategy" [9].
The five forces are: competitive rivalry within the industry, threat of new entrants, threat of substitute products or services, bargaining power of buyers, and bargaining power of suppliers. Together, they determine the competitive intensity and attractiveness of an industry.
Use Five Forces when assessing a new market entry, evaluating an acquisition, or deciding how to differentiate in a saturated space.
8. Ansoff Matrix
The Ansoff Matrix maps growth strategies across two dimensions: products (existing vs. new) and markets (existing vs. new). Igor Ansoff published the framework in 1957 in Harvard Business Review [10]. The four resulting quadrants — market penetration, market development, product development, and diversification — represent increasing levels of risk.
For teams deciding where to focus growth investment, the Ansoff Matrix makes the risk profile of each option explicit. Market penetration (selling more of your existing product to existing customers) carries different risk than diversification (a new product for a new market), and the matrix forces that conversation.
9. Strategy map
A strategy map is a visual representation of an organization's strategy that shows the cause-and-effect relationships between strategic objectives. It is closely associated with the Balanced Scorecard — Kaplan and Norton formalized the concept in their 2001 book The Strategy-Focused Organization [11].
Where the Balanced Scorecard gives you the measurement system, the strategy map gives you the logic: it shows why improving employee skills leads to better processes, better customer outcomes, and improved financial results.
10. Cascade goal framework
The cascade model links organizational-level goals to team-level objectives and individual-level activities. Each level sets goals that directly support the level above. The result is a clear line of sight between what any given employee is working on and what the organization is trying to achieve.
In practice, cascade planning often combines with OKRs: company OKRs cascade into department OKRs, which cascade into individual contributors' goals. The critical discipline is checking alignment at every level — not just setting goals, but making sure they genuinely add up.
11. Scenario planning
Scenario planning is a structured process for developing and testing strategy against multiple plausible futures rather than a single forecast. Originally developed at Royal Dutch Shell in the 1970s, the approach gained wide recognition when Shell used it to navigate the 1973 oil crisis [12].
The core method involves identifying the two most uncertain and impactful variables in your environment, plotting a 2x2 matrix of outcomes, and building a strategic narrative for each quadrant. Teams then stress-test their plan against each scenario to identify which choices hold up across multiple futures and which are bets on a single outcome.
Scenario planning is most valuable for industries facing significant uncertainty: regulatory shifts, technological disruption, or macroeconomic volatility.
Building a strategic plan: where to start

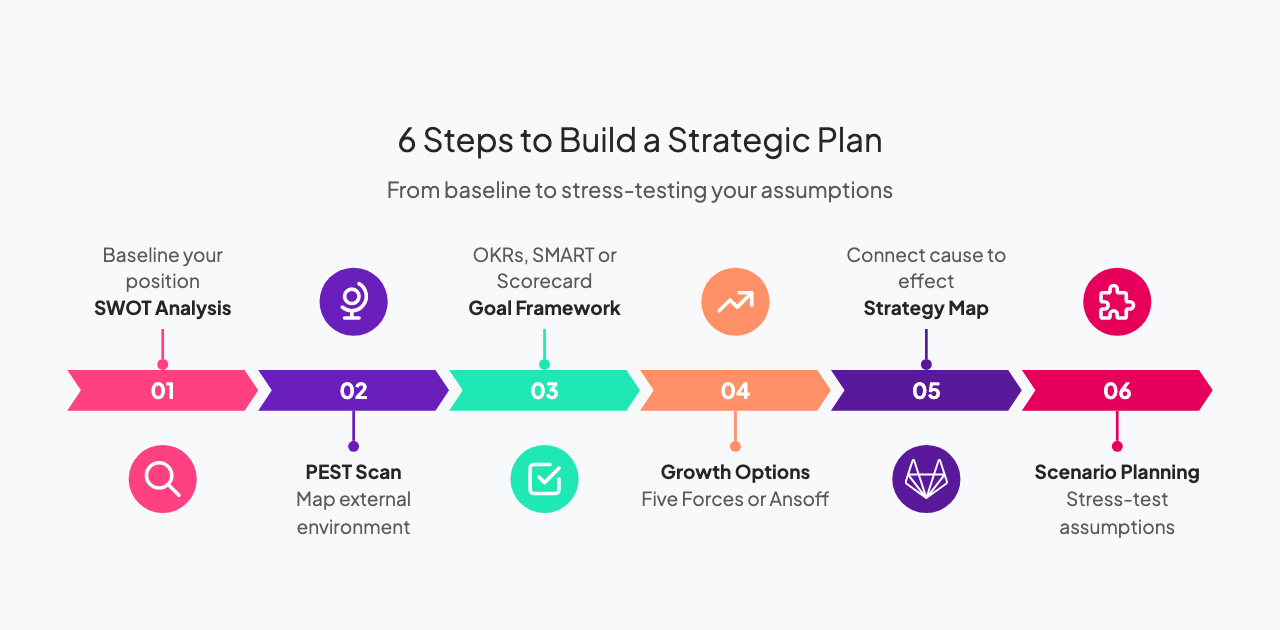
No organization needs all 11 tools at once. A practical starting sequence:
- Run a SWOT analysis to baseline where you are.
- Add PEST if you are operating in a volatile or unfamiliar environment.
- Choose a goal-setting framework: OKRs for fast-moving organizations, SMART goals for operational clarity, or Balanced Scorecard if you need multi-perspective measurement.
- Use Porter's Five Forces or Ansoff Matrix when evaluating growth options.
- Build a strategy map once the objectives are set, so the causal logic is visible.
- Run scenario planning annually to stress-test your assumptions.
The final plan does not need to be long. A one-page strategic plan — covering mission, vision, 3 to 5 goals, objectives with owners and deadlines, and key metrics — is often more useful than a 50-page document that nobody reads after it is written.
Running strategy reviews with AhaSlides
The most common failure mode in strategic planning is not the plan — it is the review. Teams set goals in January and do not look at them again until December, by which point the gap between plan and reality is too large to close.
Regular strategy review sessions keep plans alive. AhaSlides supports these sessions with live polls, rating scales, and open Q&A so you can gather input from the full team, surface concerns in real time, and reach decisions while everyone is in the room. A 30-minute review can include a live temperature check on which priorities the team feels confident about and which feel stuck — without anyone needing to speak up in front of a senior leader.
For L&D teams rolling out strategic planning training, the same approach works for teaching frameworks: run a live OKR-writing exercise, poll the group on which goals are genuinely measurable, and debrief before moving on.
Sources
[1] Kaplan, R., & Norton, D. (1996). The Balanced Scorecard: Translating Strategy into Action. Harvard Business School Press. Cited in: ClearPoint Strategy. "50+ Strategic Planning & Execution Statistics." https://www.clearpointstrategy.com/blog/strategic-planning-statistics
[2] ClearPoint Strategy. "50+ Insightful Strategic Planning & Execution Statistics." https://www.clearpointstrategy.com/blog/strategic-planning-statistics
[3] Aguilar, F. J. (1967). Scanning the Business Environment. Macmillan. Discussed in: ResearchGate. "The origins of SWOT analysis." https://www.researchgate.net/publication/368734936_The_origins_of_SWOT_analysis
[4] Aguilar, F. J. (1967). Scanning the Business Environment. Macmillan. Cited in: SCIRP. https://www.scirp.org/reference/referencespapers?referenceid=217884
[5] Grove, A. S. (1983). High Output Management. Random House. Summarized in: What Matters. "The OKR Origin Story." https://www.whatmatters.com/articles/the-origin-story
[6] Doran, G. T. (1981). "There's a S.M.A.R.T. way to write management's goals and objectives." Management Review, 70(11), 35–36.
[7] Kaplan, R. S., & Norton, D. P. (January–February 1992). "The Balanced Scorecard: Measures That Drive Performance." Harvard Business Review, 70(1), 71–79. https://hbr.org/1992/01/the-balanced-scorecard-measures-that-drive-performance-2
[8] Kim, W. C., & Mauborgne, R. (2005). Blue Ocean Strategy: How to Create Uncontested Market Space and Make the Competition Irrelevant. Harvard Business School Press. https://www.blueoceanstrategy.com/authors/
[9] Porter, M. E. (March–April 1979). "How Competitive Forces Shape Strategy." Harvard Business Review. https://hbr.org/1979/03/how-competitive-forces-shape-strategy
[10] Ansoff, H. I. (September–October 1957). "Strategies for Diversification." Harvard Business Review, 35(5), 113–124.
[11] Kaplan, R. S., & Norton, D. P. (2001). The Strategy-Focused Organization. Harvard Business School Press.
[12] Wilkinson, A., & Kupers, R. (May 2013). "Living in the Futures." Harvard Business Review. https://hbr.org/2013/05/living-in-the-futures