Gantt charts seem like some project management secret code only the pros understand.
But fear not - they're actually pretty simple once you decode how they work.
We will explain everything, answering your questions from what a Gantt chart is to how to use it effectively in your project.
| What is a Gantt chart on Excel? | A Gantt chart on Excel is a type of bar chart that helps you visualise your project timeline. |
| Why do they call it a Gantt chart? | Gantt chart is named after Henry Gantt, who popularised it around the years 1910–1915. |
| Why using a Gantt chart is good? | Gantt chart helps you look into the big picture, organise the tasks effectively and keep everyone on track. |
Table of Contents
- What a Gantt Chart is
- What is a Gantt Chart Use For?
- What Does a Gantt Chart Look Like?
- What Do Gantt Charts and Pert Charts Have in Common?
- How to Make a Gantt Chart
- Gantt Chart Software
- What are Gantt Chart Examples?
- Takeaways
- Frequently Asked Questions
What a Gantt Chart is
A Gantt chart is basically a diagram that lays out the timeline for your project.
It shows the start and end dates for each task, along with dependencies between tasks to make sure everything gets done in the right order. Plain and simple.
Gantt charts have a few key parts:
- The list of tasks: Each task in your project gets its own row on the chart.
- The timeline: The chart contains a horizontal axis marking time periods - usually days, weeks or months.
- Start and finish dates: Each task gets a bar showing when it starts and ends along the timeline.
- Dependencies: Connections show if one task must be completed before another can start.

Get your Organisation Engaged
Start meaningful discussions, get useful feedback and educate your team. Sign up to take free AhaSlides template
🚀 Grab Free Quiz☁️
What is a Gantt Chart Use For?
There are a few reasons why using a Gantt chart is good for project management:
• It provides a clear visual representation of the project timeline. Being able to see the tasks, durations, dependencies and milestones laid out visually makes it easy to understand the full schedule at a glance.
• It helps identify scheduling issues early. Looking at the Gantt chart, you can spot potential bottlenecks, overlap of critical tasks, or gaps in the timeline that could cause delays. You can then make adjustments to avoid problems.
• It helps communicate the schedule to stakeholders. By sharing the Gantt chart, you give teammates and clients a simple way to see the timeline, task owners, dependencies and planned milestones. This fosters transparency and accountability.
• It makes progress tracking clear. As you update the Gantt chart to show completed tasks, in-progress tasks and any changes, the chart provides an "at-a-glance" view of project status for you and other team members.
• It helps manage resources effectively. When tasks with resource dependencies are laid out visually, you can optimise the utilisation of people, equipment and other assets across the full timeline.
• It allows for what-if scenario planning. By making changes to task durations, dependencies and sequences on the Gantt chart, you can model different scenarios to determine the best project plan before implementing it for real.
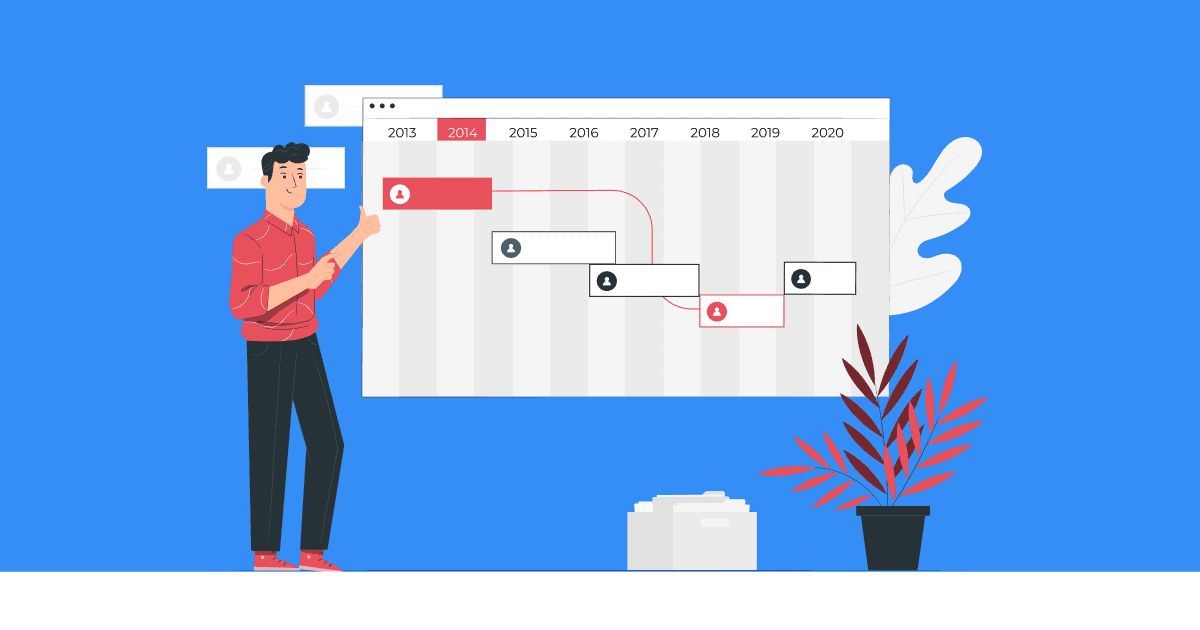
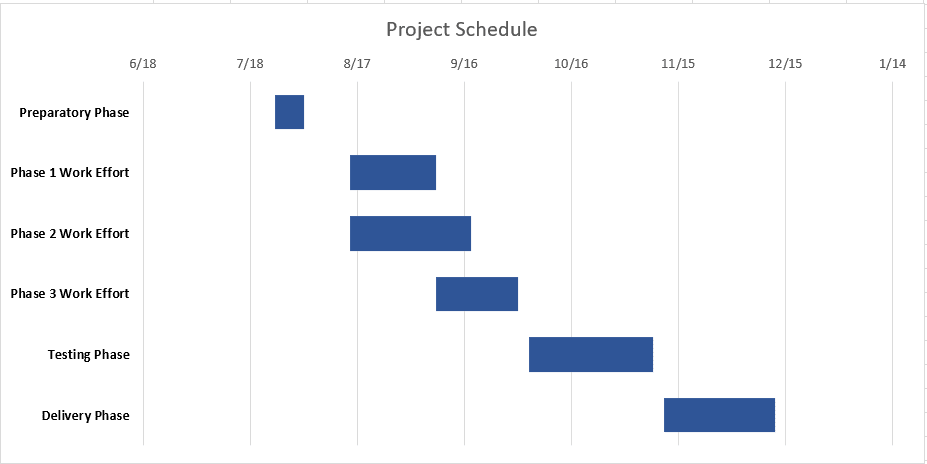
What Does a Gantt Chart Look Like?
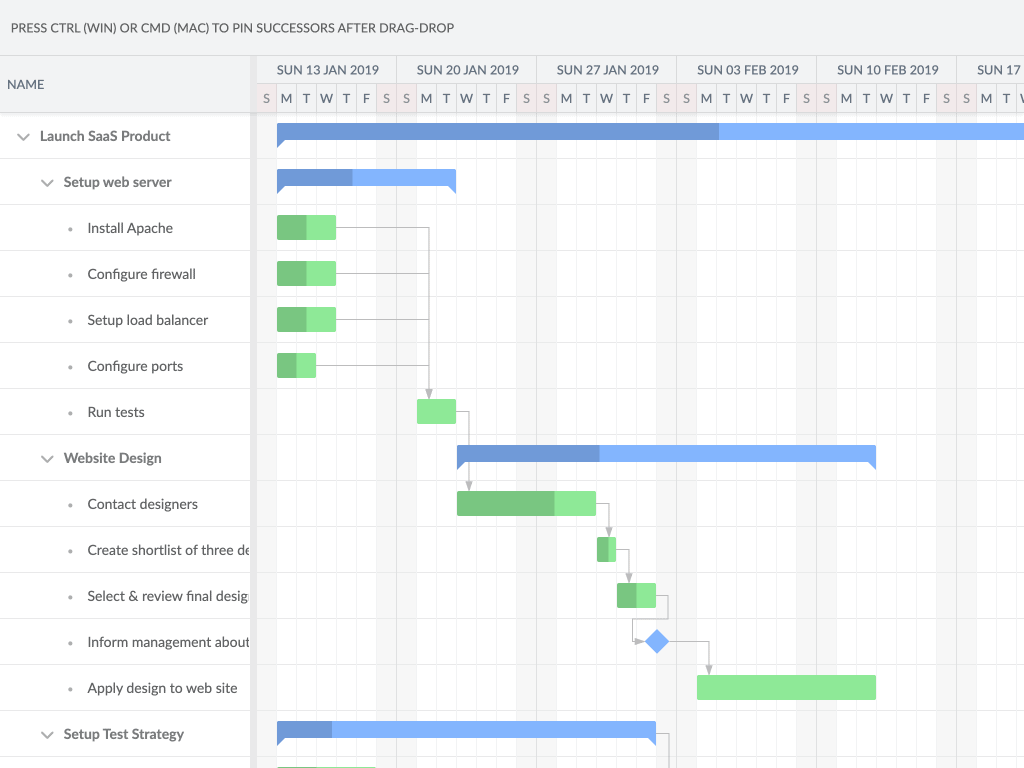
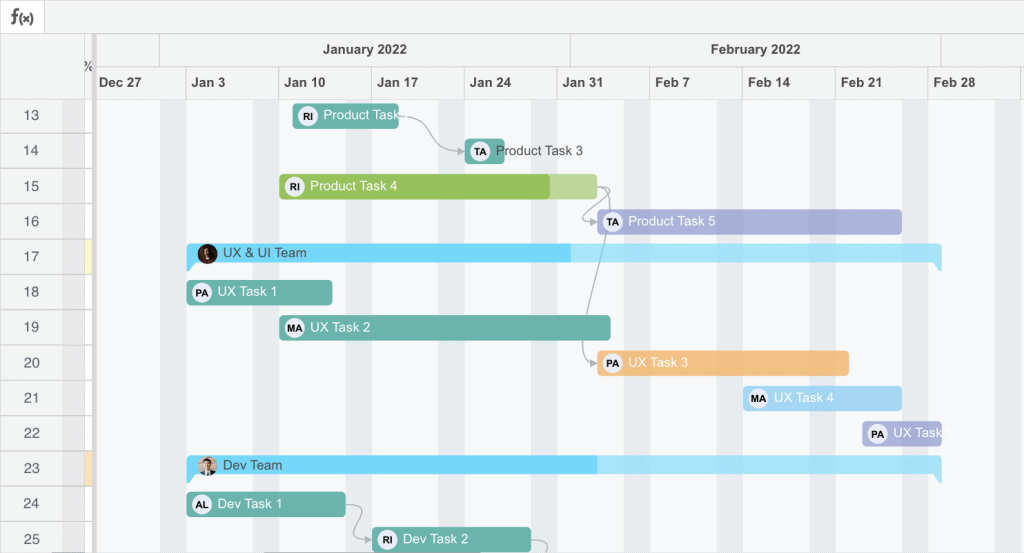
A Gantt chart visually plots tasks on a timeline. It typically includes:
• A list of tasks along the left vertical axis. Each task gets its own row.
• A horizontal time scale along the bottom, typically showing increments like days, weeks or months.
• For each task, a bar spanning from its planned start date to the end date. The bar's length indicates the task's planned duration.
• Dependencies between tasks are shown with lines or arrows connecting tasks. This shows which tasks must be completed before others can begin.
• Milestones are indicated with vertical lines or icons at specific dates. They mark important checkpoints or due dates.
• Resources assigned to each task may be shown in the taskbars or in a separate column.
• Actual progress is sometimes indicated by hashing, shading or colour-coding portions of task bars representing work that's been done.
What Do Gantt Charts and Pert Charts Have in Common?
Gantt charts and PERT charts both:
• Are project scheduling and management tools.
• Visually represent a project timeline with tasks, milestones, and durations.
• Help identify risks, dependencies, and potential issues in the project plan.
• Can be updated to reflect task progress and changes to the schedule.
• Assist with allocating and tracking resource utilisation.
• Facilitate monitoring of project status and performance.
• Improve communication by providing a clear visual representation of the project timeline and status.
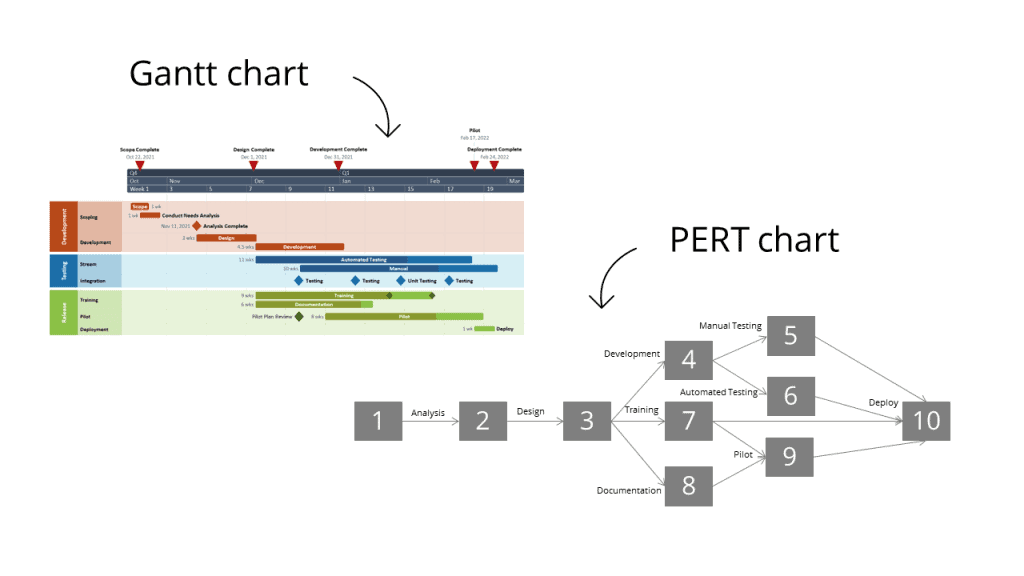
The main differences between Gantt charts and PERT charts are:
Gantt charts:
• Show the planned start and end dates of each task.
• Focus more on scheduling and timing of tasks.
• Use a simple bar chart format.
PERT charts:
• Calculate the expected duration of a task based on optimistic, pessimistic and most likely estimates.
• Focus more on the logic network that determines the sequence of tasks.
• Use a node and arrow diagram format that shows the dependencies and logic between tasks.
In summary, both Gantt charts and PERT charts aim to model and visualize a project schedule. They help with planning, tracking progress and communication. But Gantt charts focus more on the timeline and timing of tasks, while PERT charts focus more on the logic and dependencies between tasks to determine expected durations.
How to Make a Gantt Chart
Creating your Gantt chart in a spreadsheet allows for easy tracking, updating and "what if" scenario planning as your project progresses.
Here are the steps to make a basic Gantt chart in project management:
#1 - List all the tasks required to complete your project. Break larger tasks into smaller, more manageable subtasks.
#2 - Estimate the duration of each task in time units appropriate for your project (days, weeks, months, etc.). Consider dependencies between tasks.
#3 - Assign owners and/or resources to each task. Identify any shared resources with conflicting task dependencies.
#4 - Determine the start date and due date for your project. Calculate task start dates based on dependencies.
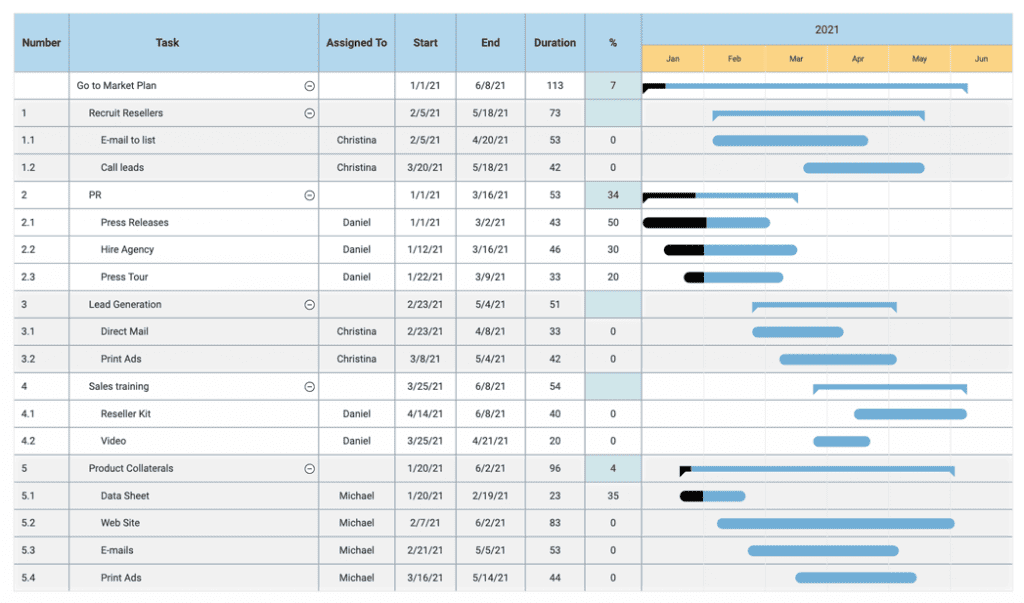
#5 - Create a table or spreadsheet with columns for:
- Task name
- Task duration
- Start date
- Finish date
- Resource(s) assigned
- % Complete (optional)
- Task dependencies (optional)
#6 - Plot the tasks on your timeline with bars spanning from start to finish dates.
#7 - Add visual representations of dependencies between tasks using arrows or lines.
#8 - Mark important milestones on your timeline using icons, shading or vertical lines.
#9 - Periodically update your Gantt chart as tasks are completed, durations change or dependencies shift. Adjust task bars and dependencies as needed.
#10 - Add a % complete or progress column and fill it in over time to indicate project status at a glance.
#11 - Use the visual timeline to identify scheduling issues, resource conflicts or risks that could cause delays. Make adjustments to improve your project plan proactively.
Gantt Chart Software
With so many options on the market, these are the ones that catch our eye for their versatile features and uncomplicated interface. Everyone from your almost-retired boss to the new intern could see, create and track the Gantt chart easily.
#1 - Microsoft Project
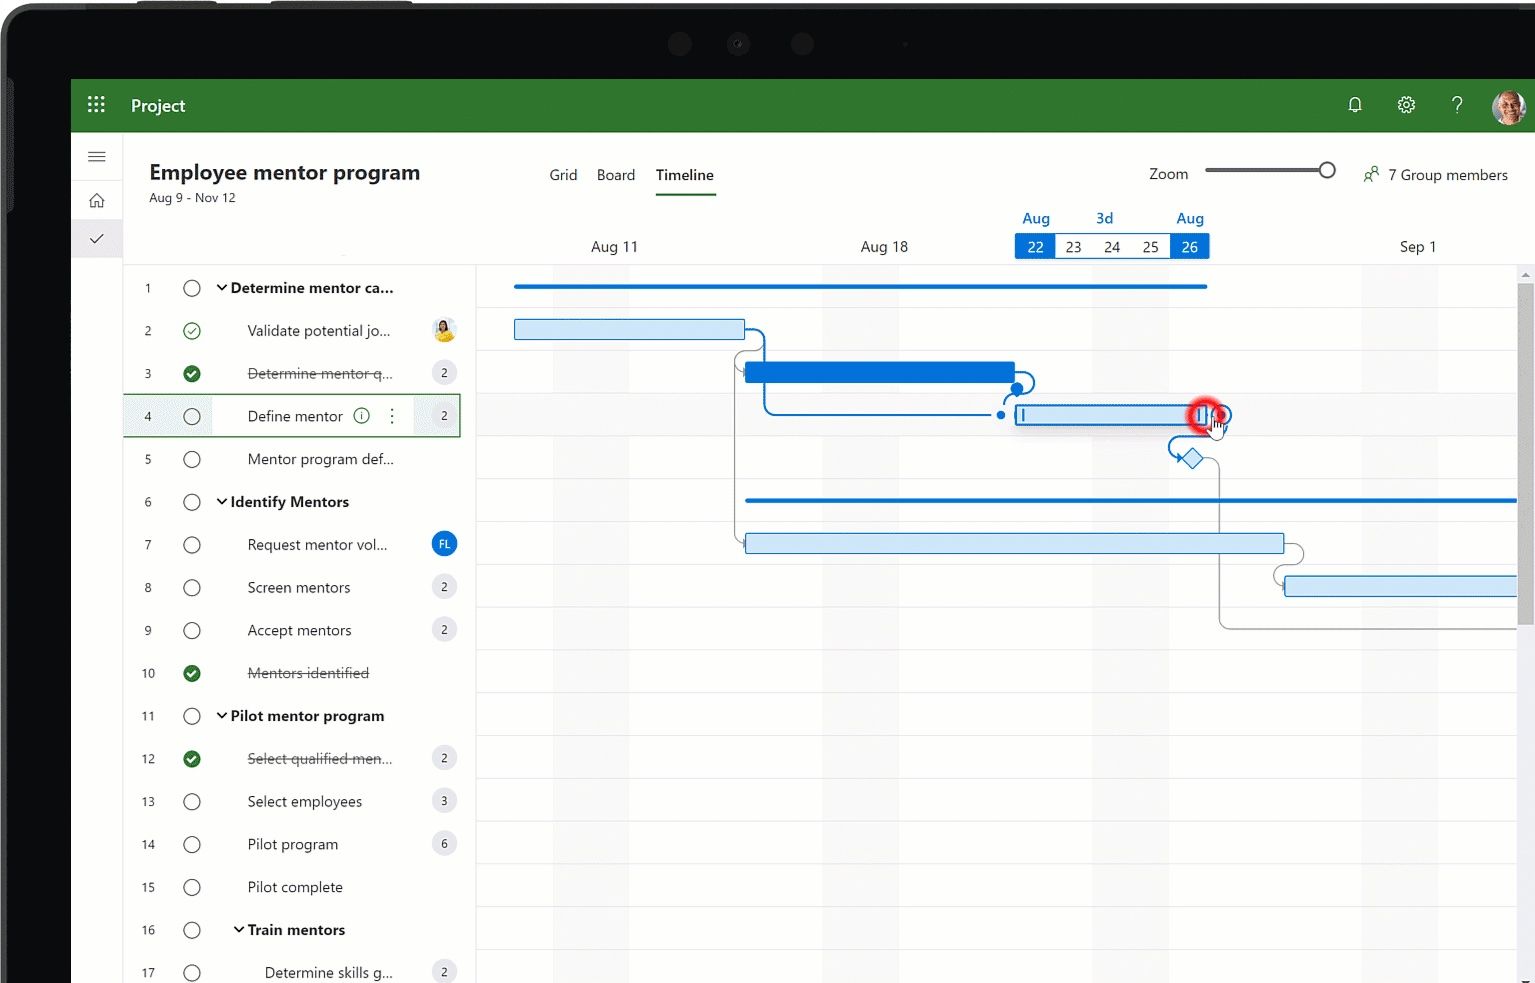
• Fully featured project management application.
• Makes it easy to create and edit tables for tasks, resources, assignments and calendar dates.
• Automatically generates Gantt chart based on table data.
• Allows for critical path, deadlines, resource levelling and other advanced features.
• Integrates with Excel, Outlook and SharePoint for project collaboration.
• Requires purchasing a monthly or annual subscription.
#2 - Microsoft Excel
• Simple to just input task details into a table and generate a chart from that.
• Lots of free or inexpensive Gantt chart add-ins with more templates and features.
• Familiar interface for most people.
• Limited in project management capabilities beyond basic Gantt charting.
#3 - GanttProject
• Open source project management application designed specifically for Gantt charts.
• Has features for describing tasks, assigning resources, tracking progress, and generating reports.
• Allows for repeating tasks, task dependencies, and calculating the critical path.
• Interface may be less intuitive for some.
• Lacks integration with other software and collaboration features.
• Free to download and use.
#4 - SmartDraw
• Includes professionally designed Gantt chart templates.
• Has features for automatic timeline creation, drag-and-drop editing, and task dependencies.
• Integrates with Microsoft Office for exchanging files and data.
• Relatively easy-to-use interface.
• Requires paid subscription, but offers free 30-day trial.
#5 - Trello
• Kanban-style project management tool.
• Add tasks as "cards" which you can drag and arrange visually on a timeline.
• View tasks across multiple time horizons from weeks to months.
• Assign members and due dates to cards.
• Basic in terms of handling dependencies between tasks, managing resources and asset utilisation and tracking progress toward milestones.
#6 - TeamGantt
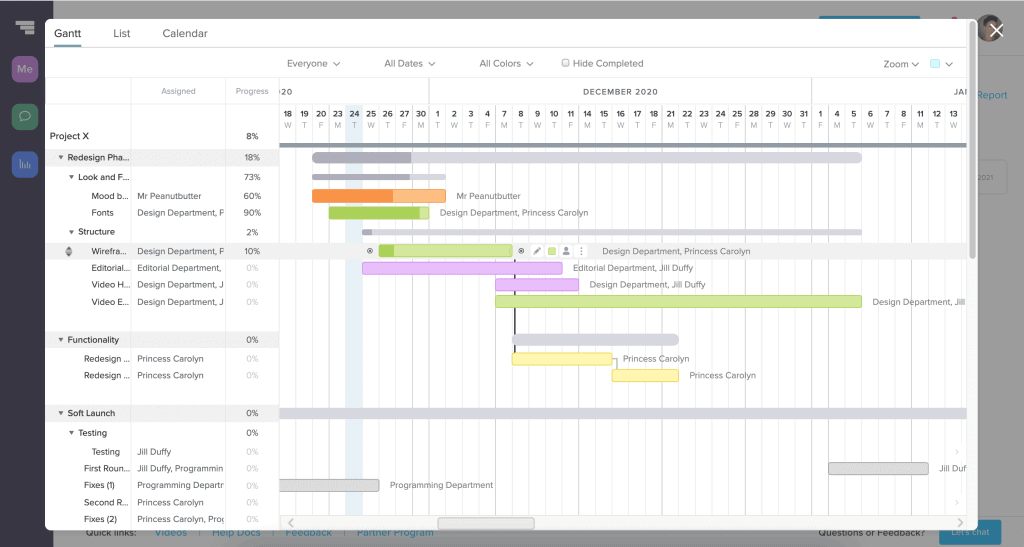
• All-in-one solution specifically for full lifecycle project management.
• Automates timeline planning and optimisation.
• Allows you to define task dependencies, model "what if" scenarios, assign and level resources across multiple projects, and track progress against milestones.
• Comes with template library and analytics reports.
• Require a paid subscription.
#7 - Asana
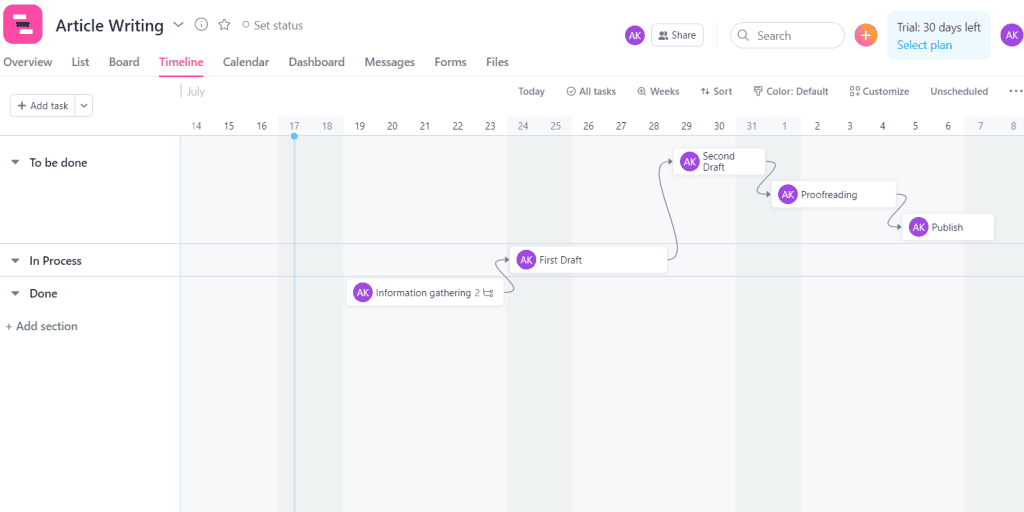
• Project management app focused on task management.
• Lacks: resource management across projects, earned value analysis, and what-if scenario planning.
• Free version. Paid tiers for more features.
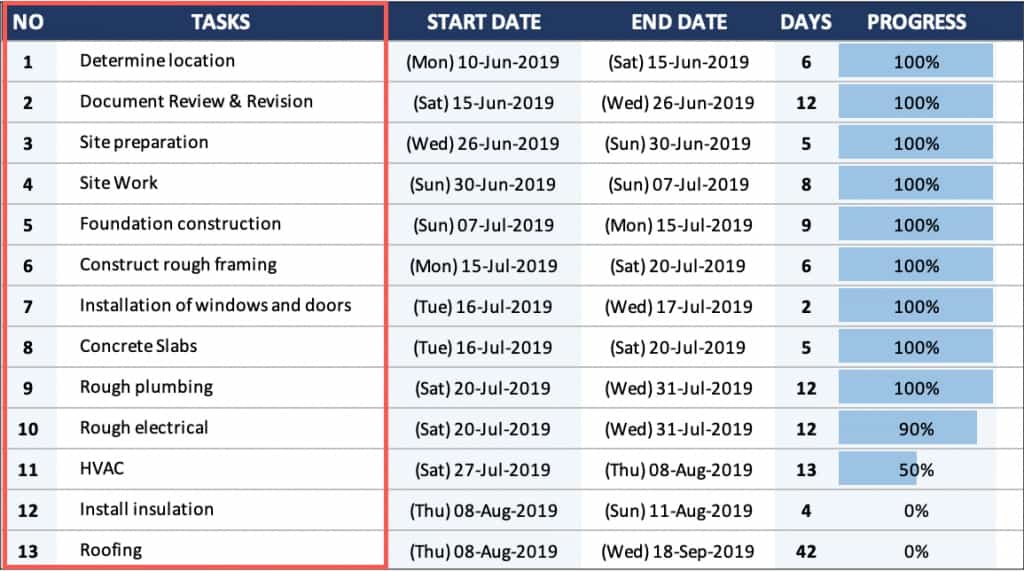
What are Gantt Chart Examples?
Gantt Charts can be used in a variety of situations. Here are some prime examples:
• Project schedules: A Gantt chart can visually lay out the timeline for any type of project with tasks, durations, dependencies and milestones. This could be for construction projects, event planning, software engineering, research studies, etc.
• Manufacturing schedules: Gantt charts are often used in manufacturing to plan production runs, showing the scheduling of all steps from material acquisition to assembly to packaging and shipping.
• Resource allocation: Gantt charts can help optimise the allocation of resources like people, equipment and facilities across multiple projects over time. Colour coding tasks by resources can make this clear.
• Progress tracking: Gantt charts for projects in progress can be updated to show the actual start/finish dates for completed tasks, slippage on in-progress tasks and any changes or delays. This provides a view of the project status.
• What-if scenarios: By adjusting task sequences, durations and dependencies on a Gantt chart, project managers can model alternatives to determine the most efficient schedule before implementing for real.
• Communication tool: Sharing Gantt charts with stakeholders provides a visual summary of project milestones, task owners and planned vs actual timelines that boost alignment and accountability.
In general, Gantt charts can be applied to any scenario where visualising a sequence of tasks, dependencies and timelines may provide insights to optimise plans, allocate resources, track progress and communicate status. The specific examples are endless, limited only by people's creativity and needs for clarity and efficiency.
Takeaways
Gantt charts are so effective because they translate complex project timelines and dependencies into a simple visual that is easy to understand, update and share. The key benefits lie in improved scheduling, communication, progress tracking and planning, which makes them favoured among project managers.
Frequently Asked Questions
Why are Gantt charts so good?
Why Gantt Charts Are Effective
- Visual timeline - see full plan at a glance
- Early issue detection - spot potential problems visually
- Communication - foster clarity and accountability
- Planning - dependencies and priorities become clear
- Progress tracking - updated chart shows the status
- What-if analysis - model alternatives
- Integration - work with project management software
Gantt charts translate complex timelines and dependencies into simple visuals that are easy to understand, update and share.
The benefits come from improved scheduling, communication, tracking and planning
What are the 4 components of a Gantt chart?
Gantt chart requires 4 aspects: bars, columns, dates and milestones.
Is Gantt chart a timeline?
Yes - a Gantt chart is fundamentally a visual timeline representation of a project schedule that helps with planning, coordination and management. The chart plots task information on an x-y axis to translate complex timing, dependencies and durations into a simple, scannable format.