
Turn everyone’s ratings into one live radar chart

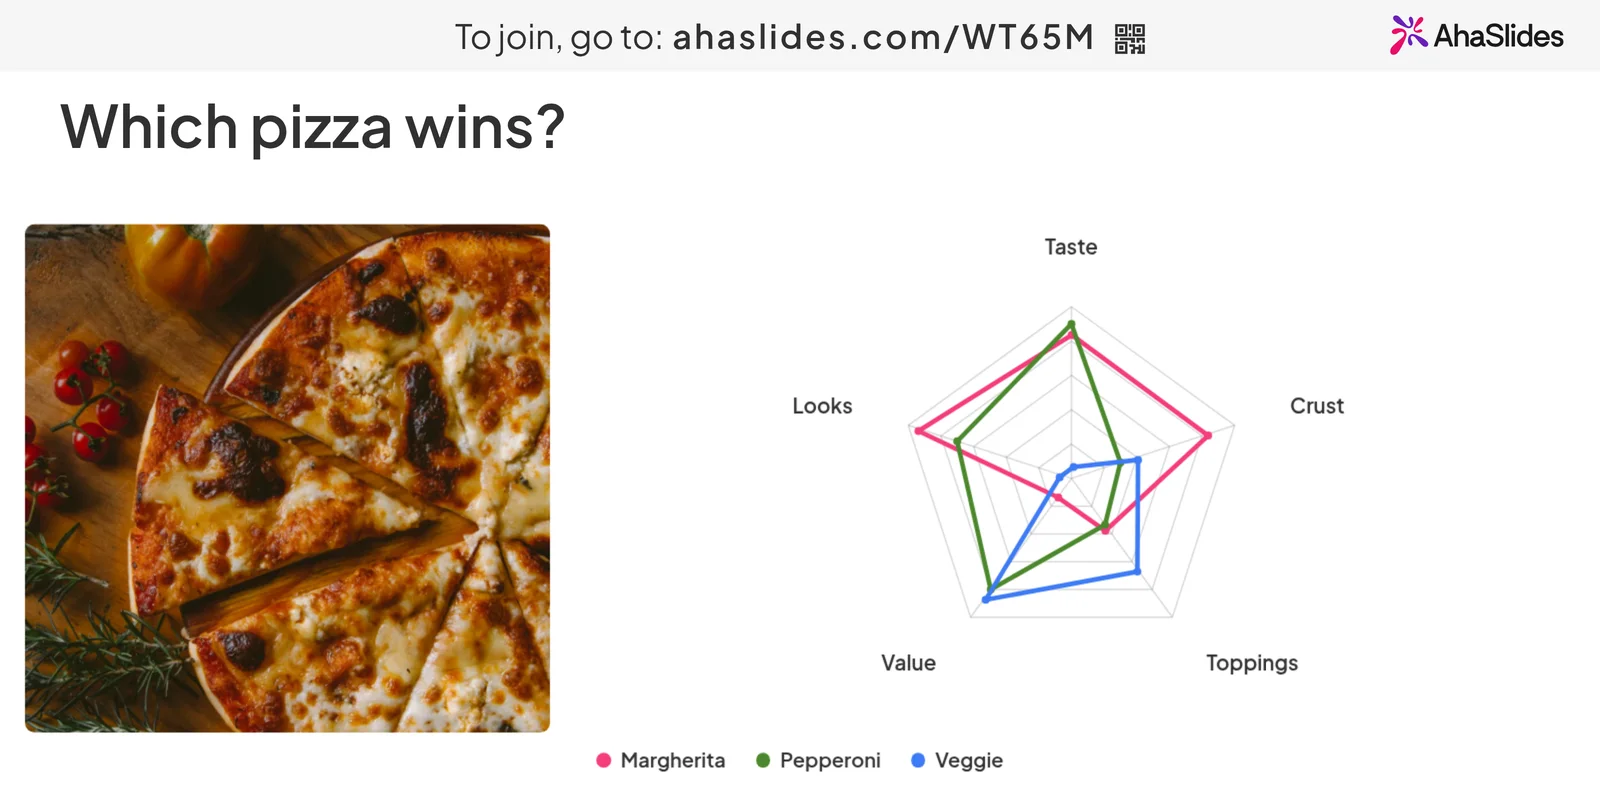
Rate a team, a workshop, a skill set or a pizza on several points at once. Each person rates on their own phone and the shape builds on screen as answers arrive.

Create a radar chart free

Free plan for up to 50 live participants. Your first chart can be live in about a minute.

Rated 4.7 out of 5 on G2, based on 386 reviews

Trusted by teams and schools worldwide

  • Abu Dhabi University logo
  • Airbus logo
  • Bend La Pine Schools logo
  • BMC logo
  • Bosch logo
  • Criteo logo
  • Ferrero Rocher logo
  • Intel logo
  • Ivy Tech Community College logo
  • Le Quiz Show logo

Make a radar chart in three steps

  1. Step 1: Add a Radar slide

    Click New slide, search for Radar and pick it.
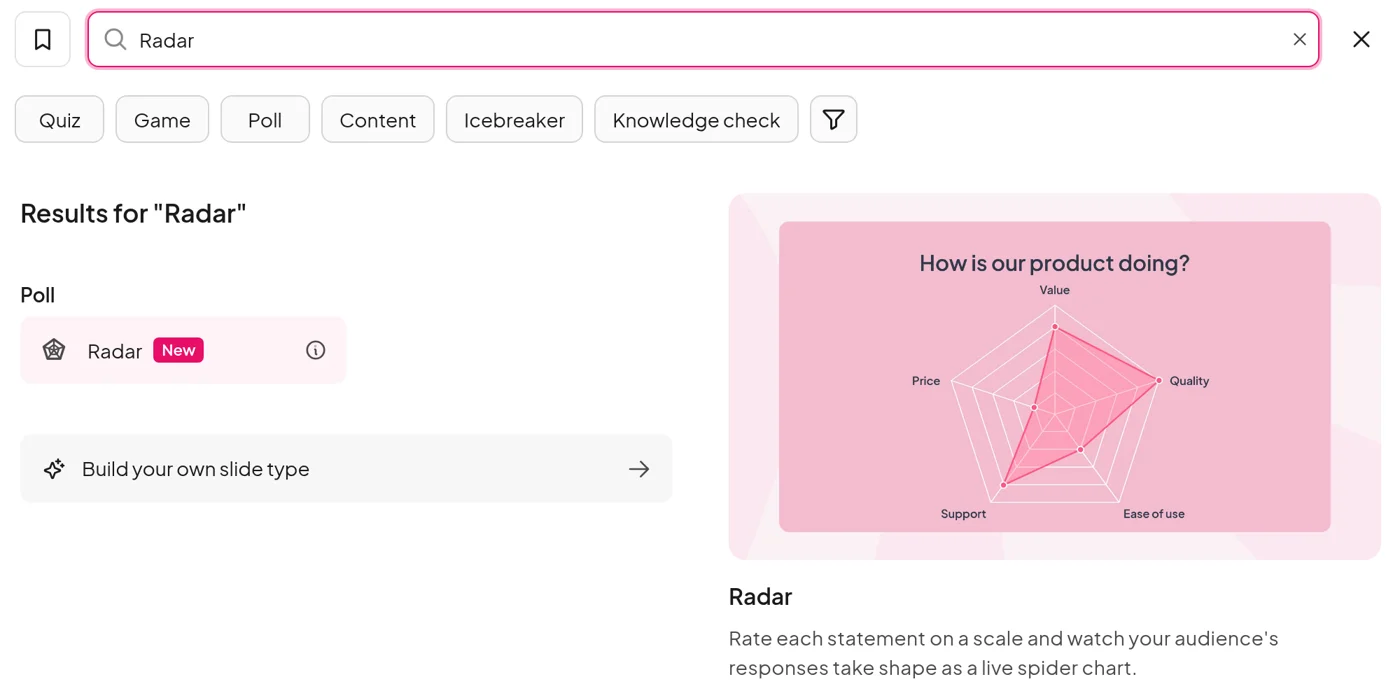
    The AhaSlides slide type picker with Radar found under Poll and a preview of a radar chart
  2. Step 2: Name what to rate

    Type your question, add 3 to 8 dimensions and choose a 1 to 5, 1 to 10 or 0 to 100% scale.
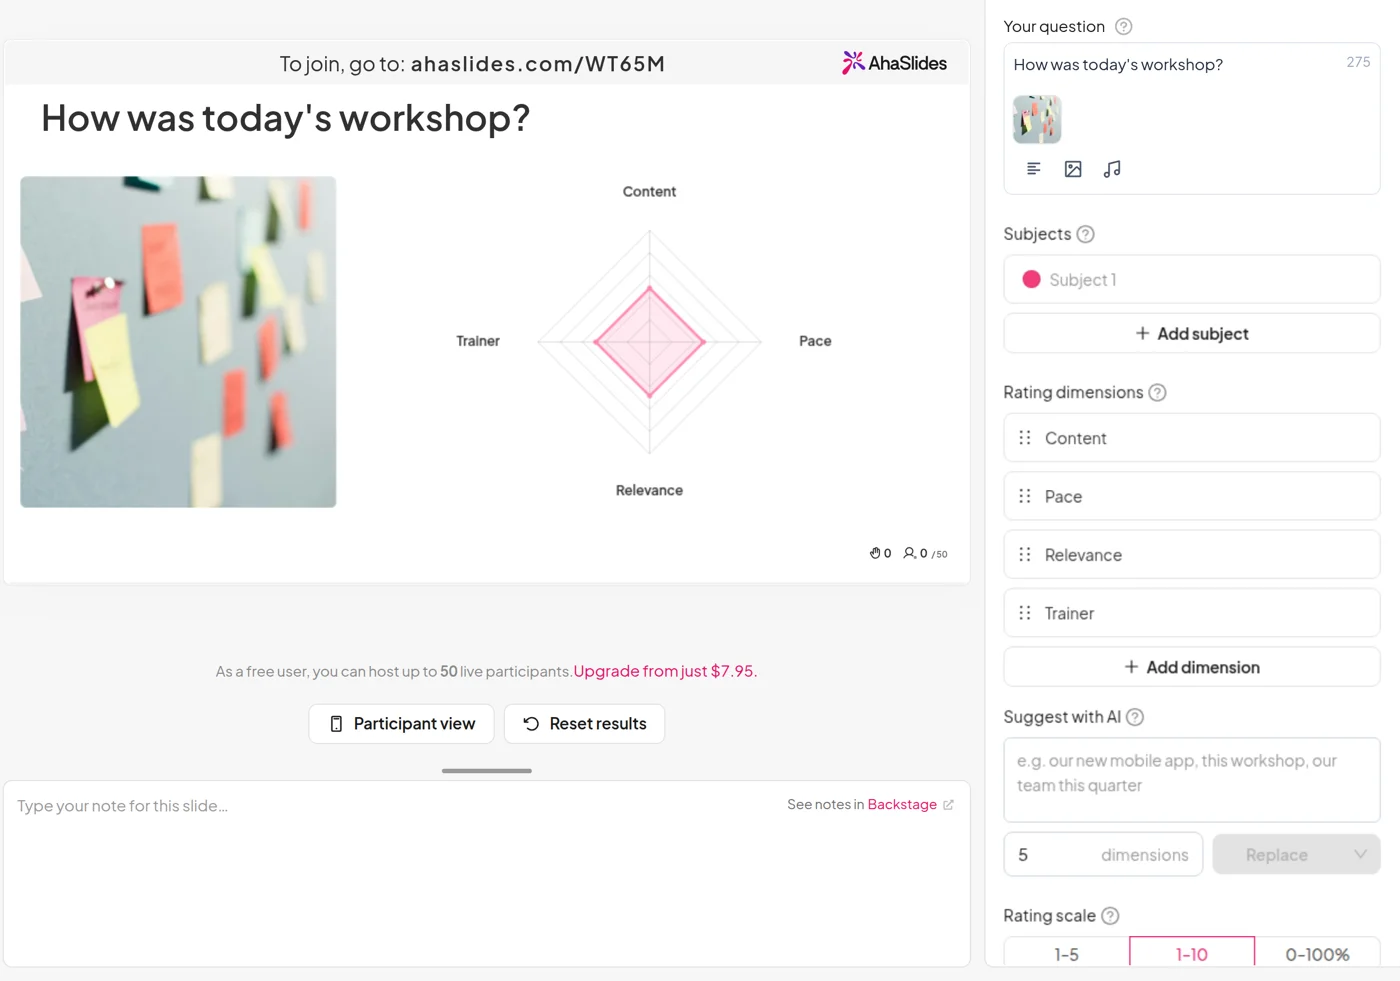
    The AhaSlides editor with a Radar slide for a workshop review: four dimensions and a 1 to 10 scale
  3. Step 3: Present

    Share the QR code and ratings arrive as people send them. No app, no account.
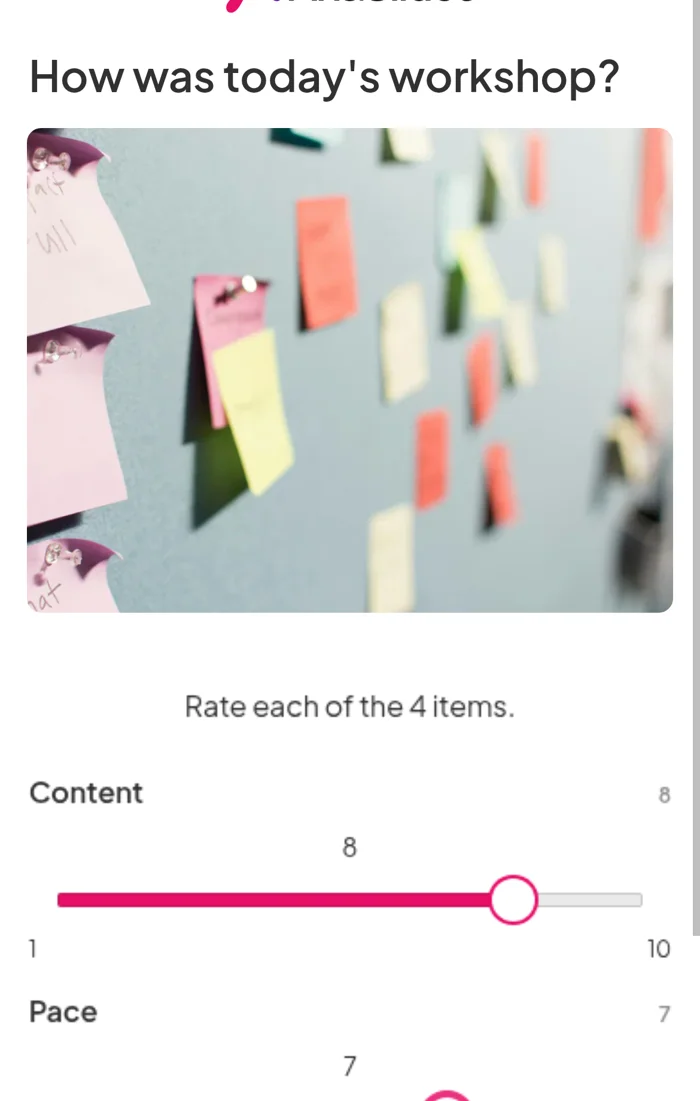
    A phone rating a workshop on Content, Pace, Relevance and Trainer with sliders from 1 to 10
Create a radar chart free

Watch the shape build, then compare

Create a radar chart free
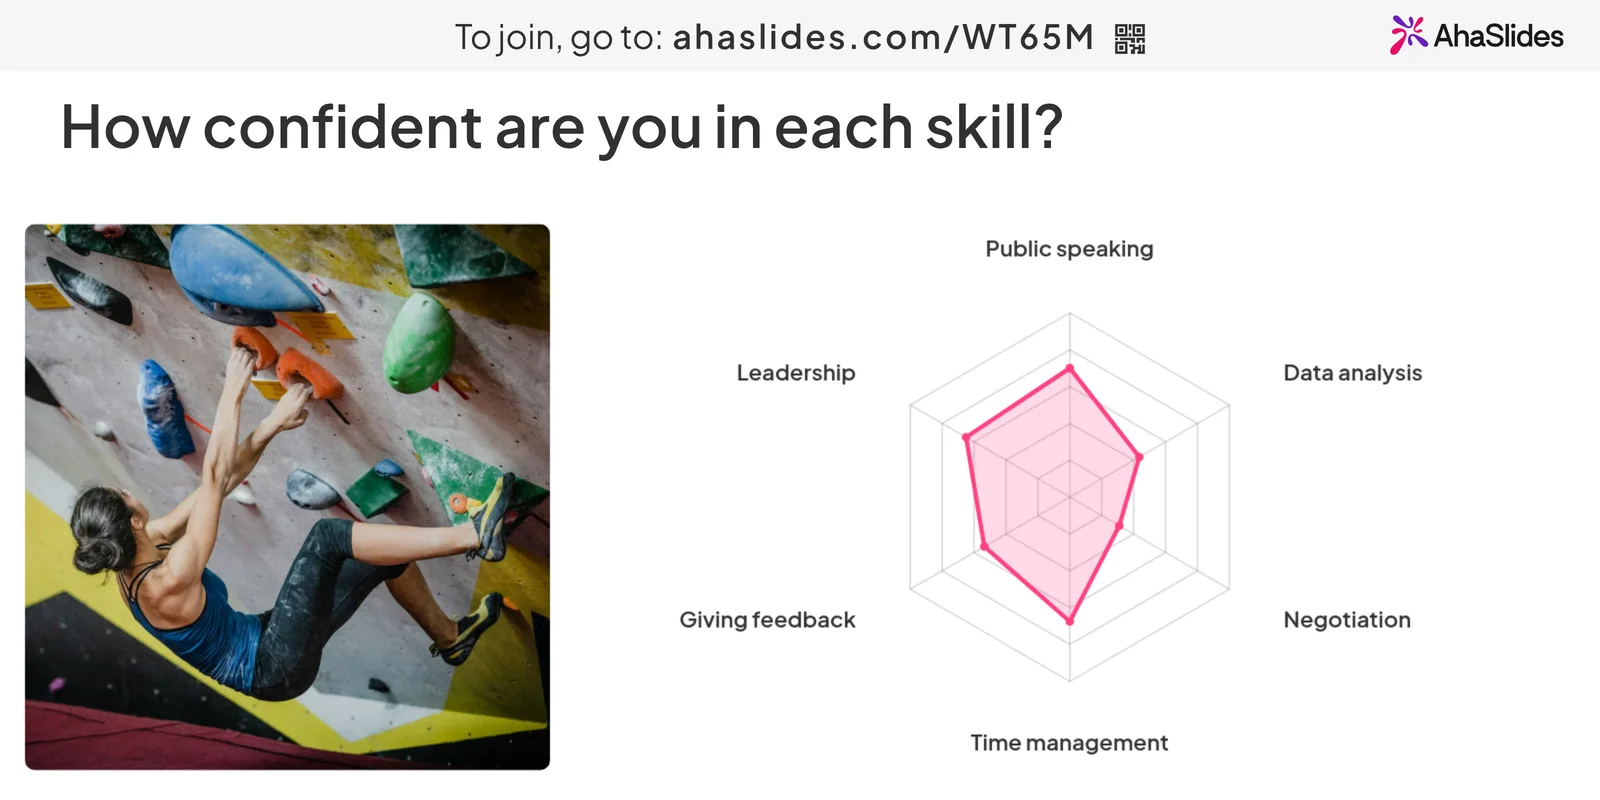
A live radar chart of seven people rating their confidence in six skills from 0 to 100%, beside a photo of a climber

See the shape live, keep the numbers after

  • After the session

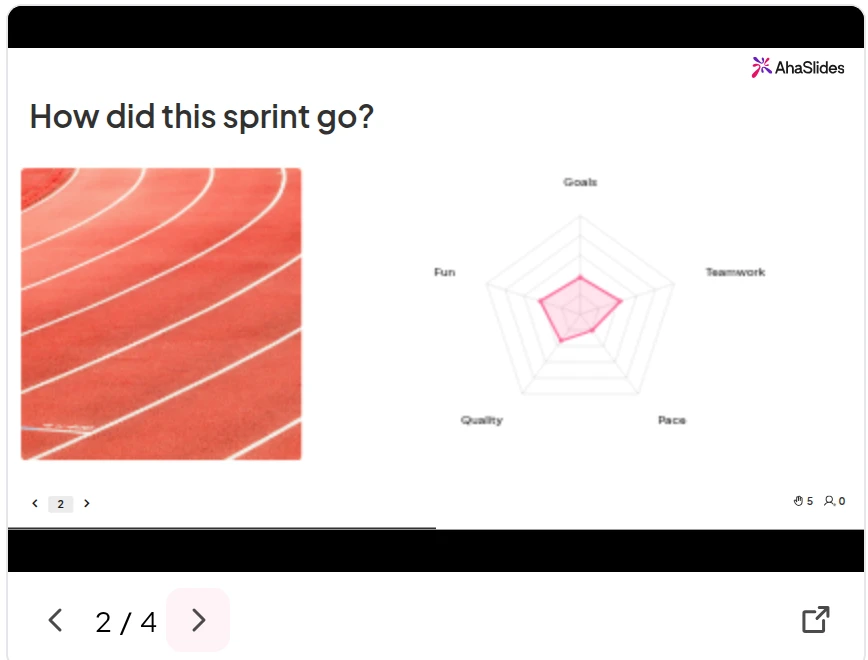
    The session report keeps a replay of every slide with its final chart, and counts who took part and how many ratings came in.
    Create a radar chart free
    The AhaSlides session report replaying the sprint review radar slide, slide 2 of 4

Where teams and trainers use it

  • Team health checks and retros

    Rate communication, workload and morale, then talk about the spoke that pulls in furthest.

  • Workshop and session reviews

    Close the day with content, pace and relevance, and know what to change before the next group.

  • Skills self-assessment

    Learners rate their confidence on day one and again at the end. The shape shows what the course moved.

Create a radar chart free

Not sure what to rate? Ask AI

  • Let AI write the dimensions

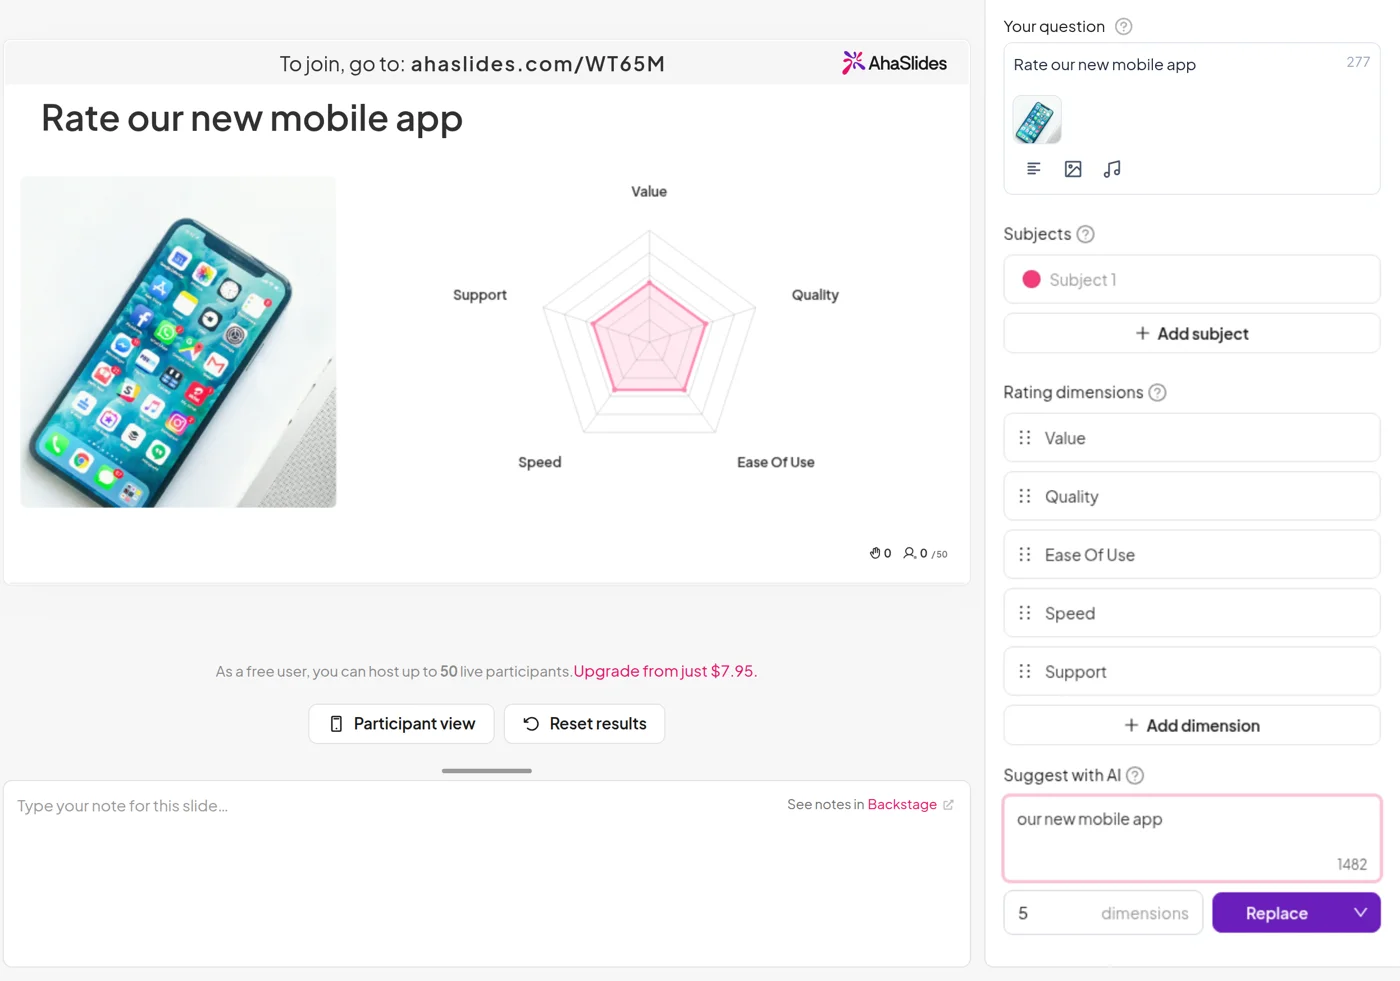
    Describe your topic, choose how many dimensions you want and press Generate. AI writes them for you. Name two or three things to compare and it fills in the subjects too.

    Edit anything it suggests, or add more without losing the list.
    Create a radar chart free
    The Radar settings in the AhaSlides editor after Suggest with AI wrote Value, Quality, Ease of use, Speed and Support for the topic our new mobile app

Scorecards and warm-ups too

  • Product and supplier scorecards

    Have beta users rate a new app, or score suppliers on price, quality and service.

  • Warm-ups and icebreakers

    Rate a film, a holiday spot or the office coffee on taste, value and wow factor. Instant debate.

Create a radar chart free

One slide for check-ins, courses and quiz nights

  • 1M+

    participants every month

  • 30+

    interactive question types

  • 200+

    countries and regions

Create a radar chart free

What people say about AhaSlides

  • “I can build a poll in a couple of minutes before a meeting, and people can join from their phones without needing to download an app.”

    Verified User, Mid-Market business from G2
  • “It's a quick way to create quizzes, since it provides an AI tool that helps me put them together.”

    Ajmal K., Information Technology Officer from G2
  • “AhaSlides for me was a big win. Without a doubt it gives a voice to my students to speak and feel valued.”

    Jo Patton, Remote Teacher for Church of England
Read reviews on G2 (opens in a new tab)

Frequently asked questions

A radar chart, also called a spider chart, plots several ratings around one centre, so strengths and gaps show up as a single shape. In AhaSlides the shape is the room’s average for each dimension, and it updates as ratings come in. Strong areas stretch to the rim and weak spots pull towards the centre, so the gap is plain before anyone speaks.

No. They scan the QR code or open the join link in their phone’s browser and start rating.

With one subject, no. Anyone who skips a dimension is asked to confirm before sending, and each average only counts the people who rated it. When you compare two or three subjects, every rating is needed before Submit works.

No. It collects opinions, so there are no right answers, no points and no leaderboard.

No. Dimensions, subjects and the scale lock with the first rating so the chart stays accurate. Resetting the results unlocks them.

A Rating scale slide shows how answers spread along each statement. A radar chart combines every average into one shape, which is quicker for spotting gaps or comparing options.

Yes. Turn on Scores under Advanced and each dimension’s average appears on the chart.

“This is my go to platform for all my training events.” Rajesh B., Enterprise Academy Lead from G2.

Up to three. Each subject draws its own outline, so this sprint against last, or one venue against another, reads at a glance.

Three scales: 1 to 5 for a gut check, 1 to 10 or 0 to 100% when small differences matter. Five reveal animations: Bloom, Crystallise, Pinwheel, Vortex and Radar sweep. For a picture beside the chart, add an image and set it to the left or right.
Read the help centre (opens in a new tab)